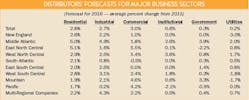
It’s a tricky time right now for economic forecasters. Some regional market areas are white-hot, while others are struggling. The early national forecasts for single-family residential construction in 2016 call for some impressive double-digit growth from a comparatively low level of homebuilding activity over the past few years, but many local markets won’t see anything near that type of residential growth.
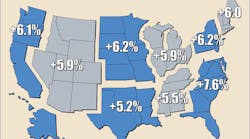
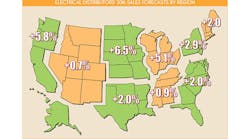
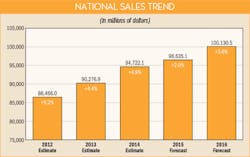
This uncertainty sets the stage for what appears to be modest sales forecast by our survey respondents for 2016. Electrical Wholesaling’s editors took the responses from more than 200 executives from around the United States and massaged the recently released 2012 Census of Wholesale trade data to develop a forecast for 3.6% growth next year and an overall market for electrical supplies sold through full-line electrical distributors of $100.1 billion. This growth figure is pretty close to the low end of the historical 4% to 8% annual growth range for the electrical wholesaling industry. Once you factor in a point or two for inflation, you are looking at a slow-growth/no-growth scenario for the electrical market in 2016.
Single-family residential construction looks hot, hot, hot. While the overall level of single-family construction activity isn’t expecting to get near the over-heated record heights it achieved before the recession, the National Association of Home Builders (NAHB), Washington, D.C., expects 27% growth in 2016 single-family housing starts to 914,000 in the United States and another year of 20%-plus growth in 2017 to crack the 1 million mark for single-family starts the first time in 10 years. Economists say pent-up demand, relatively low interest rates and an upswing in the all-important number of first-time home buyers will support this solid growth over the next two years. There’s no mystery to where all of this homebuilding will be happening — just follow the population growth, which is, to no one’s surprise, more intense in the Sunbelt, particularly in Florida and Texas. Some Metropolitan Statistical Areas (MSAs) in these states are already enjoying super-strong double-digit growth in building permits. In 2015, the large metros already seeing this type of 20%-plus growth year-to-date in building permits (a dependable early indicator of future single-family construction) include Phoenix (+39%), Dallas (+29%); Portland, Ore. (+28%); Miami-Ft. Lauderdale (+28%); Tampa-St. Petersburg (+22%); and Nashville (+21%). EW’s editors also spotted some sizzling single-family permit activity and population growth in some smaller markets, too. These small metro stars include the Fayetteville-Springdale-Rogers region in northwest Arkansas (+38%); Cape Coral-Fort Myers, Fla. (+31%); Ogden, Utah (+26%); and Provo, Utah (+25%). While few electrical distributors focus on the residential market as much as the commercial or industrial markets, this segment accounts for an estimated 17% of overall industry sales and can’t be overlooked. Once new housing developments are in, retail and light-commercial construction is soon to follow.
Auto industry gearing up for growth in Detroit. More than any other state, Michigan reflects this resurgence in the auto market. The state’s preliminary Sept. 2015 BLS data shows 603,900 industrial workers and a 4.4% YOY increase, easily outpacing the anemic 0.7% increase in total U.S. manufacturing employment over the same period. The state’s manufacturing employment numbers are running hot in large part because of renewed investment in factories by the Big Three auto manufacturers and the suppliers that feed them. The biggest projects include General Motors’ $520 million investment in its Delta Township plant near Lansing, Mich.; the $245 million it’s spending at its plant in Orion, Mich., and the $139.5 million for a new body shop and metal stamping equipment in its Warren, Mich., plant; and the $124 million for a retrofit of its metal stamping plant in Pontiac, Mich. And in August GM announced it would be investing $877 million in its truck plant in Flint, Mich.
LED retrofits. While some customers and market segments may continue to question the pay-more-now-for-future-savings of LEDs, they are flooding the lighting industry and replacing conventional lighting systems in more and more applications. Parking lot and roadway lighting seem to be the newest market segments LED lighting manufacturers are working on, judging from the amount of new products seen in the booths at Lightfair International over the past two years and in the number of press releases promoting new LED parking lot fixtures and roadway fixtures Electrical Wholesaling’s editors receive.
To learn a more about the regional markets that Electrical Wholesaling’s editors believe may offer the most promise in 2016, check out the “Pockets of Prosperity” sidebar on page 20.
HOW TO USE THE MARKET PLANNING GUIDE
The market planning data in this issue is divided into nine regions of the United States. For each region, you’ll find sales forecasts for this year and next year, along with the three prior years’ sales. We no longer provide sales forecasts for individual states because of concerns about the accuracy of the data at that more local level. In addition to the sales forecasts, prepared by EW’s research department, you’ll also find an economic snapshot of the region and employment statistics for four of electrical wholesalers’ major customer groups: electrical contractors, the commercial market, the industrial market and government. New this year is state-level data for Gross Domestic Product, collected through 2014 by the U.S. Bureau of Economic Analysis.
Methodology. Our forecasts are based upon responses to EW’s annual Market Planning Guide (MPG) survey. Each year, the magazine asks electrical distributors for their previous year’s final sales results, sales predictions for the current year, and predictions for the following year. It also asks respondents how sales for the first six months of the current year compared with the first six months of the previous year.
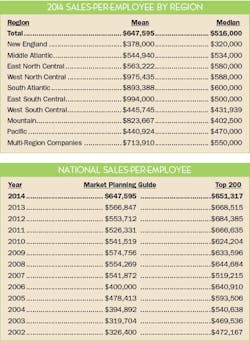
We mailed 4,626 (both by mail and via e-mail) and received 237 usable responses for a 5.1% response rate. Respondents reported a mean sales-per-employee number of $647,595 in 2014, up substantially from the $566,847 respondents reported for 2013, and the $553,712 respondents reported for 2012 but remarkably close to the $651,317 that 113 full-line distributor respondents to this year’s Top 200 survey who provided both sales and employee figures for 2014.
Regional sales-per-employee numbers are provided on page 18. Be sure to check how your company’s productivity compares with the national and regional averages when it comes to sales-per-employee.
A note on our national sales base number. The base sales number for our national sales forecast comes from the Census of Wholesale Trade that the Commerce Department sends out every five. Data from the most recent survey in 2012 was finally available this year for the category that most closely defines our electrical market —“NAICS: 423610 - Electrical apparatus and equipment, wiring supplies, and related equipment merchant wholesalers” (specifically “Merchant wholesalers, except manufacturers’ sales branches and offices”).
While the U.S. Commerce Dept. does an incredible job on the Census of Wholesale Trade survey with what are reportedly very limited resources, it appears they have a very broad definition of wholesalers that fit into NAICS: 423610. Their location count of 13,789 for these companies is more than double what EW’s editors have been able to verify for what most industry execs would consider to be distributors of electrical supplies. There’s little doubt that distributors in EW’s Top 200 listing operate the majority of the branches in the electrical market, and in the 2015 Top 200, EW’s editors verified that the 200 largest distributors in the electrical market operate 6,284 branches in North America (including Canada). We are certain that the Top 200 account for the vast majority of branches in the electrical industry, but the U.S. Commerce Dept. location count is more than double that of the Top 200 total count.
The Census of Wholesale Trade 2012 sales figure for NAICS 423610 is $107,489,479, a number that based on their number of branch locations is well beyond EW’s sales estimates for the electrical market. Our reasoning goes back to the data we collect from electrical distributors for the Top 200. Our best estimate for the amount of 2014 sales accounted for by the Top 200 distributors was $65.3 billion, and that these companies probably account for 65% of all industry sales. While a few medium-sized electrical distributors always decline to provide any data for our Top 200 survey, we aren’t missing enough of them to bring our sales data much closer to the Census sales data.
Employment data. The employment numbers in the Regional Factbook can help you develop forecasts for customer buying potential. Compiled from publicly available data at www.bls.gov, the website for the federal government’s Bureau of Labor Statistics (BLS), the Regional Factbook data published in this issue is just a small sampling of what what’s available from BLS. If you want to drill down into more specific types of customers, search for the Current Employment Statistics (CES); if you want to dig into specific types of jobs look for the Occupational Employment Statistics (OES).
EW’s Customer, Market and Product Mixes. As in the past few years, this data is only available online at www.ewweb.com. Just go to the website and click on “Data and Training” and then “Market Planning Guide.” The Customer Mix and Market Mix are great resources if you’re looking for sales breakdowns for full-line distributors’ key customer and market segments. The Product Mix data offers valuable insight into the product areas that have the most mind share with electrical distributors. Over the years, some of the product categories have been consolidated or eliminated because their contributions to electrical distributor sales were consistently less than one percent. See the text accompanying the chart for a full explanation of the changes. At www.ewweb.com you will also find expanded capsule summaries for each of the main regions as well as a ton of other local market data.
Getting the full picture on a market area isn’t that difficult. When developing any market forecast, gathering some basic data on the size and makeup of the market is the first step. Let’s take a look at some of the ways you can crunch the numbers we’ve provided to tailor them to your specific business and market.
Sales estimates. One of the most common uses of this resource is for developing a business plan, whether it be for internal use as your guide for next year or for a presentation to an investor or banker. You will need something that states the size of the local market, and these sales figures are a documented source you can use “as is.”
This data will also be helpful in establishing a sales forecast for your company and your region, comparing nearby or far-flung markets with an eye to opening or closing a branch, and evaluating promising areas of new business. One question distributors should ask themselves — and suppliers will be asking — is: “Are our sales into the market at the level they should be?” Look at the estimate of the overall sales in your market in comparison with your company’s sales.
Employment in major customer markets. In addition to sales forecasts, employment numbers make up a large part of the regional profiles. The number of people employed by a company or in an industry tends to rise and fall with the volume of business it’s doing. Employment figures, therefore, act as a gauge to business prospects and conditions in end-user markets.
• Employee counts can help you compare the relative sizes of various end-user groups in your area.
• You can also compare the make-up of one market area to another, and consider new customer markets or ones that you could be serving better.
• If you track the employment figures for each market over time, you’ll see broad economic trends unfolding in your market.
• You can also use these employment figures to make your own multipliers or you can use the national multipliers we’ve already calculated.
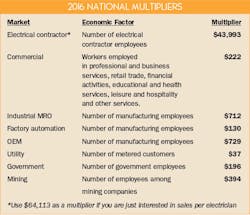
Multipliers. Each multiplier is a dollar figure that represents the average amount of electrical products distributors sell to each particular type of customer, on a per-employee basis or other “economic factor.” (See EW’s National Multipliers on page 17). When used with the employment figures in the regional profiles, the multipliers help establish the amount of business electrical distributors could do with major customer groups in your area, and in total.
For instance, you can go into greater detail by using locally available sources of information on employment or other measures in end-user industries. The professionals at the nearest business library should be able to direct you to a source for the numbers you need. These multipliers are also a good option for determining sales in an area of the country not covered in the list of major metropolitan areas in the regional profiles. The same approach applies if you want to look at one county in an MSA that covers six counties. You would have to obtain employment figures or economic factors from local sources.
For instance, to find the number of electrical contractor employees in Addison, Ill., a city not detailed in the East North Central regional profile, you could contact the local Chamber of Commerce, a nearby union chapter, the state university, the state’s department of commerce or the local library to track it down.
These multipliers come in handy if you want to approximate the amount of sales available from a particular account. For example, if a local manufacturer employs 300 people, by applying the multiplier of $712, you would expect the facility to purchase about $213,600 worth of electrical MRO products this year.
Using multipliers results in a dollar figure for market size that tells the level of business electrical wholesalers in the area could do if every potential customer there bought a typical amount of product from them. It tends to be a larger number than actual distributor sales. You can also use EW’s multipliers to track sales through different types of customers over time. Let’s do that for sales through electrical contractors. Using EW’s national multiplier of $43,993 in sales for each electrical contractor employee and contractor employment through August of 826,200, that’s roughly $36.3 billion in sales. As a side note, at the peak of the current business cycle in Oct. 2007, electrical contractors had 943,700 employees nationally, a 117,500 decline in employment and a $5.2 billion decline in market potential.
Summary. As long as the overall economy doesn’t stumble due to some unforeseen circumstances, Electrical Wholesaling’s editors think 2016 will be a year of slow growth and that business will be good for companies in the geographic market areas mentioned in the side bar and in the business niches mentioned above.


