Latest from Market Planning Guide

104750065 / Sashkinw / DreamsTime
104750065 / ashkinw / DreamsTime
Hero Image
Downtown San Diego construction project / Metro Market Data
San Diego Construction1024
scanrail/iStock/Getty Images Plus
Ewweb 6268 2019 Ew Market Planning Guide Pr

Measuring Your Metros

July 31, 2019
Photo courtesy of www.flyreagan.com
Ewweb 5086 Market Planning 2018 Pr 20
512ewnatfact1595.jpg

National Factbook 2015

Dec. 2, 2015
Conflicting economic signals from the construction and industrial business segments make it tougher to gauge the electrical industry in 2016, but good growth opportunities still exist in some market segments.

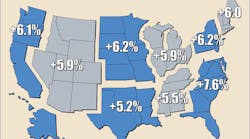
The decline in the industrial market segment over the past two quarters seems to have a cast a shadow over any optimism for the overall 2016 electrical market.  And that’s a shame, because the construction market should more than pull its weight in 2016 with some steady if unspectacular growth forecast for the commercial building segment and big-time growth expected in the single-family construction market.  The construction outlook for 2016 definitely has a “Tale of Two Cities”  flavor  to it, with a select handful of local markets like Boston, New York, Miami, Austin the San Francisco Bay Area/San Jose and Seattle, enjoying the best of times, and many other markets slugging it out in a slow growth/no growth scenario.

All eyes seem nervously focused on the industrial market right now, which between the MRO (maintenance and repair operations); OEM (original equipment manufacturers) and factory automation segments combine to power roughly 19% in total industry sales, according to Electrical Wholesaling’s Market Planning Guide data. With the exception of some new auto plants and other manufacturers feeding Motown’s auto industry, the industrial market started to slide in the latter half of 2015.

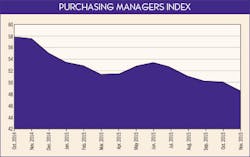
One of the more important leading economic indicators for the industrial market, the Purchasing Managers Index published monthly by the Institute for Supply Management, Tempe, Ariz., has lost steam over the past year, and in November it slid into contraction territory for the first time since Nov. 2012. The crash in the oil market is well-known, and the Baker Hughes Rig Count, a handy leading economic indicator measuring this wildly cyclical market segment, continued to decline through November. Year-over-year, there are more than 1,100 fewer oil rigs operating in the United States (on land and offshore).  While some of the industrial market news is pretty grim, it’s sending out some positive signals, too. National manufacturing employment through Oct. 2015 isn’t showing any significant decline and capacity utilization in industrial facilities has grown over the past year.

At his presentation during the recent NEMA annual meeting, Don Leavens, vice president and chief economist for the National Electrical Manufacturers Association (NEMA), Washington, D.C., told members he is concerned about the possibility of a continued industrial slowdown because of a hesitancy by companies to invest in brick-and-mortar, hurting capital expenditures; heavy global debt loads; and the comparatively low number of people in the U.S. workforce.

Electrical Wholesaling’s editors think growth for next year in the overall electrical market will settle in somewhere in the low single digits, well above some of the  more dire predictions for the industrial market, but substantially below the sizzling growth forecasts for the residential business.

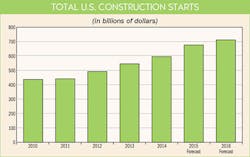
Total U.S. Construction Starts

Dodge Data & Analytics

Bob Murray, V.P.  of economic affairs and chief economist for Dodge Data & Analytics, sees a pretty solid year for the overall construction market with a 6% increase to $712 billion in total construction starts for next year. That’s off the rapid pace of the last few years largely because it includes a 1% decline in the Manufacturing Buildings construction segment and a -43% decline in the Electric Utilities and Gas Plants segment. Dodge attributes  this  decline to the tough-to-duplicate number of LNG plants that broke ground in 2015.

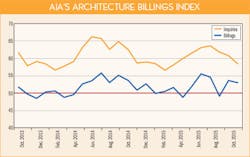
Architecture Billing Index (ABI)

American Institute of Architects (AIA)

The Architecture Billings Index (ABI) provides one of the best leading indicators  in the construction market because it measures business at architectural firms when projects are still on the drawing boards. AIA says this index reflects the approximate nine- to twelve-month lead time between architectural billings and construction spending. Both inquries for new projects on the drawing boards and actual billings spent most of 2015 in growth territory, boding well for the construction market in 2016.

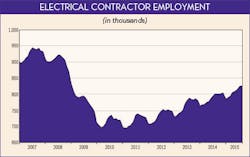
Electrical Contractor Employment

Bureau of Labor Statistics

With electrical contractors often accounting for 50% or more of the average electrical distributor’s business, any shift in employment trends can drastically affect sales through the channel. The national employment picture is one of the more encouraging indicators out there right now because the most recent data shows 3.2% year-over-year growth. National electrical contractor employment is well over the 800,000 mark that indicates a solid employment picture.

Manufacturing Employment

Bureau of Labor Statistics (BLS)

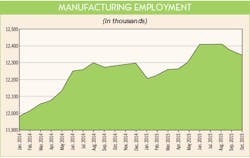
This will be an important economic indicator in the months ahead. Distributors, reps and manufacturers will need to watch any major changes in industrial employment, because it has a direct impact on the electrical market. Each employee at a factory can represent on average $712 in MRO business, $729 in OEM business and $130 in sales of factory automation products, according to the national multipliers in Electrical Wholesaling’s 2016 Market Planning Guide.

Electrical Manufacturers’ Shipments

U.S. Department of Commerce

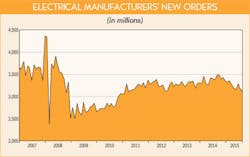
Shipments of products by U.S. electrical manufacturers offer a direct measure of the level of activity in the electrical manufacturing community, and the industrial market’s health.  In today’s market environment, the most current data probably reflects the malaise that seems to settling over some segments of the industrial marketplace. There definitely has been some slippage in 2015, with shipments down -7.2% year-to-date. This will be an interesting indicator to watch over the next few quarters.

Purchasing Managers Index (PMI)

Institute for Supply Management

The Institute for Supply Management’s monthly  Manufacturing Report on Business always provides an interesting check on the industrial market’s vital signs. Any reading at 50 points or over indicates a growth environment.  After the PMI’s November decrease to 48.2 points, many economists will be watching this leading indicator closely over the next few months to see if the November decline was a temporary market blip or the sign of something worse.

Electroindustry Business Conditions Index (EBCI)

National Electrical Manufacturers Association (NEMA)

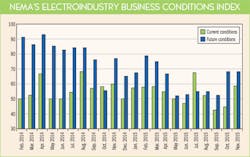
NEMA’s EBCI Index, recapped monthly in Electrical Wholesaling’s Electrostats department, is a good read on what NEMA electrical manufacturers think about current and future market conditions in the electrical business. Any reading above 50 points toward a growth environment. The EBCI indicators for both current and future conditions have been pretty jumpy in 2015, but at year end they were both in growth territory.

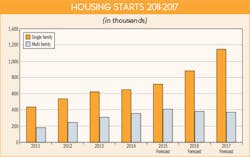
Housing Starts 2011-2017 Forecast

National Association of Home Builders (NAHB)

Many local markets can expect big things from housing construction in 2016. That’s good news for the electrical market, because once home buyers move into new developments, light retail and commercial construction like supermarkets, gas stations and restaurants follows. The large increases NAHB expects for 2016 and 2017 are impressive, but the data is a bit deceiving because these increases are coming off of the low levels of building activity in the Great Recession.

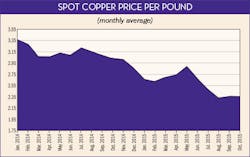
Copper Prices

Global Insight and www.kitco.com

How low will they go? That’s the question everyone wants answered about copper prices. Spot prices for copper are down about $1 per pound over the past year, and some metals market analysts think they could sink below $2 per pound for the first time in many years.  Declining copper purchases from China, which accounts for more than 40% of global copper demand, continues to drive pricing down, and it may be some time before we see copper prices recover in any meaningful way.