2014 Market Planning Guide
When you look ahead at 2014, you may feel like you have seen this movie before.
We have an economy that’s still slowly recovering from a recession that started five years ago. There’s a major controversy over the impact of ObamaCare on small businesses. And there’s that same frustration over the latest game of Congressional chicken going on in Washington and whether it will derail the economy altogether or just continue to make business owners hesitate to invest in their businesses because of the uncertainty over the status of governmental funding, credit, interest rates, taxes and federal programs.
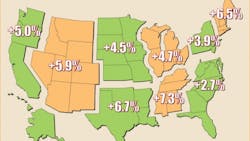
Few electrical distributors, electrical manufacturers or independent manufacturers’ reps feel overly optimistic about their chances for getting growth at a much higher rate than what they have experienced over the past few years. Indeed, Electrical Wholesaling’s forecast for 2014 sales growth of 4.9% is only a fraction of a percentage point better than what distributor respondents saw for 2013 and is at the low end of the electrical wholesaling industry’s historic annual growth range of 4% to 8%.
However, Electrical Wholesaling’s editors think the prospects for improving business conditions are a bit better than they might appear on the surface because of the health of some of the core market drivers and some important changes in several different aspects of the energy market.
If, and it’s a big “if,” Washington politicians from both sides of the aisle somehow come to a compromise on a sensible federal budget over the next few months, they would do a whole lot to lift the air of uncertainty and improve business confidence. When business owners believe economic growth is for real they are much more likely to start investing in their companies. And once they start increasing their capital expenditures and expanding existing facilities or building new ones, it will create demand for the full range of products that electrical distributors stock. The impact of such a broad, macroeconomic trend will of course vary by regional markets.
As you will see in the Regional Factbook summaries on pages 23 to 32, some markets are already growing like gangbusters and others haven’t seen any sustainable momentum in their local economies. Like a lot of things in life, for most EW readers business growth over the next year will be in direct proportion to the amount of effort you invest in it. But things are happening in the U.S. economy today that weren’t on anyone’s radar a few short years ago. Let’s take a look.

The sustained recovery of the residential market. While the residential market typically accounts for no more than 20% to 25% of the average electrical distributor sales, a healthy housing market has far-reaching effects on a local geographic area. New home owners buy new things for their homes, whether it’s patio furniture, new carpeting and appliances or home theaters, lawn mowers and landscaping supplies, and anyone in the market selling these items benefits from an influx of new homeowners. These new homeowners need places to shop, eat and gas up their cars, so an increase in light commercial construction — the sweet spot of many a distributor’s market mix—typically follows.
The horrific decline in the residential market — which reached 70% in many areas from an overbuilt high of 1,474,000 single-family homes and 1,812,000 total residential starts in 2006 scared the daylights out of everyone and it seemed like it would never fully recover.
But it has been recovering, slowly but surely. It probably wouldn’t be healthy for the residential market to hit the 2006 all-time high, because that level of building was unsustainable and was in part fueled by questionable, no-money-down financing to first-time homeowners who really couldn’t afford to buy a house. But over the past four years total housing starts have increased 67% and single-family starts have increased 42% from the 2009 trough in the market.
The National Association of Home Builders (NAHB), Washington, D.C., thinks this growth trend will continue and is calling for solid 2014 increases in total housing starts (+25%); single-family starts (+31%); and multi-family starts (+10%). That’s nothing but good news for the electrical wholesaling industry.
The boom in shale oil and gas extraction is spreading into new markets. Electrical Wholesaling’s editors have written quite a bit about all the excitement in North Dakota about its Bakken oil and gas business and how it’s had a direct impact on the distributors with branches in the western region of the state and the electrical manufacturers and independent reps who supply electrical products for North Dakota’s petrochemical business.
But other states have found that hydraulic fracturing technology, or fracking, which has been used so effectively in the Bakken is unlocking previously unattainable oil and gas assets in their backyards, too. Texas is no stranger to the oil business, and is using hydraulic fracking in its Eagle Ford Shale region, as are Ohio with its Utica Shale formation; Pennsylvania, New York and Ohio with the Marcellus shale deposits; and Kansas and Oklahoma with the Mississippi Lime Play.
Along with tapping into business on the drill sites themselves, electrical companies are enjoying sales from all of the many support industries involved with this part of the petrochemical industry, including the new pipelines and railroads needed to transport the natural gas or oil; the housing projects, restaurants, gas stations and other support services for the workers in these oil and gas fields. Before too long we should start seeing the port construction involved with building the liquid natural gas (LNG) terminals to export LNG outside the United States.
All of this construction, along with the long-term positive impact of having new dependable energy sources close at home that can cut down on our country’s reliance on foreign oil has far-reaching positive effects on the U.S. economy, exports and national security.
LED lighting may have finally reached a tipping point. By now you are probably sick of hearing about the potential that LEDs have to revolutionize the lighting world. But 2013 may be the year when the price and quality of LEDs finally becomes acceptable to the masses and to the customers who weren’t previously sold on LEDs. Big Box stores like Home Depot, Lowe’s and now Walmart wouldn’t be devoting so much shelf space to LEDs if they weren’t getting an acceptable return on investment. And with the price for LEDs from some of the better-known lighting brands hovering around the $10 per lamp mark (half of what it was just a few short years ago), color that looks awfully close to that emitted by incandescents and their superior lamp life, this might really be the time for LEDs to outshine other lighting sources.

Think about the discussion earlier in this article about business owners with renewed confidence in the economy investing in facility retrofits or building new locations. If electrical marketers can convince them that LEDs should be their lamp of choice because of their more marketable payback, we could be talking about a huge boost to the solid-state lighting market.
Conclusion. If you are an optimist and see big things for 2014, you will have to get past at least one really big “if” to see good growth next year. The biggest question is if Washington politicians can compromise on a workable federal budget and spending cuts and don’t shut the government down again. If they cut a deal that keeps everyone reasonably happy, Electrical Wholesaling’s editors think the impact of a growing residential market, the booming oil & gas business and the growth of LEDs and other energy-saving technologies can push the industry toward growth that’s a point or two higher than the 4.9% that our distributor survey respondents forecasted for 2014.
HOW TO USE THE MARKET PLANNING GUIDE
The market planning data in this issue is divided into nine regions of the United States. For each region and state, you’ll find sales forecasts for this year and next year, along with the three prior years’ sales. In addition to the sales forecasts, which are prepared by Electrical Wholesaling’s research department, you’ll also find an economic snapshot of the region and employment statistics for four of electrical wholesalers’ major customer groups: electrical contractors, the commercial market, the industrial market and government.
Methodology. Our forecasts are based upon responses to Electrical Wholesaling’s annual Market Planning Guide (MPG) survey. Each year, the magazine asks electrical distributors for their previous year’s final sales results, sales predictions for the current year, and predictions for the following year. It also asks respondents how sales for the first six months of the current year compared with the first six months of the previous year. This year, Electrical Wholesaling mailed 4,146 surveys (both by mail and via e-mail) and received 218 usable responses for a 5.3% response rate.
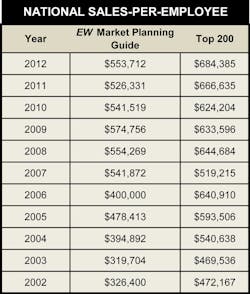
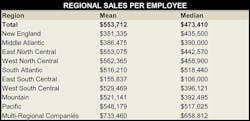
Respondents reported an average sales-per-employee number of $553,712 for 2012, up from the $526,331 respondents reported last year for 2011 and quite a bit lower than the $684,384 average sales per employee for the 115 full-line distributor respondents to this year’s Top 200 survey who provided both sales and employee figures for 2012. Regional sales-per-employee numbers are provided on page 18. Be sure to check how your company’s productivity compares with the national and regional averages when it comes to sales-per-employee.
Employment data. The employment numbers help develop forecasts for customer buying potential. Compiled from publicly available data at www.bls.gov, the website for the federal government’s Bureau of Labor Statistics (BLS), the Regional Factbook data published in this issue is just a small sampling of what what’s available from BLS. If you want to drill down into more specific types of customers, search for the Current Employment Statistics (CES); if you want to dig into specific types of jobs look for the Occupational Employment Statistics (OES).
EW’s CUSTOMER, MARKET AND PRODUCT MIXES
To get to this data, click on Customer Mix, Market Mix or Product Mix. They are great resources if you’re looking for sales breakdowns for full-line distributors’ key customer and market segments. The Product Mix data offers valuable insight into the product areas that have the most mind share with electrical distributors. Over the years, some of the product categories have been consolidated or eliminated because their contributions to electrical distributor sales were consistently less than one percent. See the text accompanying the chart for a full explanation of the changes. To find expanded capsule summaries for each of the main regions as well as a ton of other local market data, go to links at the bottom of this page and search for the region you need.
Getting the full picture on a market area isn’t that difficult. When developing any market forecast, gathering some basic data on the size and makeup of the market is the first step. Let’s take a look at some of the ways you can crunch the numbers we’ve provided to tailor them to your specific business and market.
Sales estimates. One of the most common uses of this resource is for developing a business plan, whether it be for internal use as your guide for next year or for a presentation to an investor or banker. You will need something that states the size of the local market, and these sales figures are a documented source you can use “as is.”
This data will also be helpful in establishing a sales forecast for your company and your region, comparing nearby or far-flung markets with an eye to opening or closing a branch, and evaluating promising areas of new business. One question distributors should ask themselves — and suppliers will be asking — is: “Are our sales into the market at the level they should be?” Look at the estimate of the overall sales in your market in comparison with your company’s sales.
Employment in major customer markets. In addition to sales forecasts, employment numbers make up a large part of the regional profiles. The number of people employed by a company or in an industry tends to rise and fall with the volume of business it’s doing. Employment figures, therefore, act as a gauge to business prospects and conditions in end-user markets.
- Employee counts can help you compare the relative sizes of various end-user groups in your area.
- You can also compare the make-up of one market area to another, and consider new customer markets or ones that you could be serving better.
- If you track the employment figures for each market over time, you’ll see broad economic trends unfolding in your market.
- You can also use these employment figures to make your own multipliers or you can use the national multipliers we’ve already calculated.
Multipliers. Each multiplier is a dollar figure that represents the average amount of electrical products distributors sell to each particular type of customer, on a per-employee basis or other “economic factor.” (See EW’s National Multipliers below). When used with the employment figures in the regional profiles, the multipliers help establish the amount of business electrical distributors could do with major customer groups in your area, and in total.

Note. *Use $66,627 as a multiplier if you are just interested in sales per electrician. The electrician employment data in the EW Regional Factbook is from May 2012, which is unfortunately the most recent data the U.S. Bureau of Labor Statistics has on its website (www.bls.gov) on electrician employment at the local level.
For instance, you can go into greater detail by using locally available sources of information on employment or other measures in end-user industries. The professionals at the nearest business library should be able to direct you to a source for the numbers you need. These multipliers are also a good option for determining sales in an area of the country not covered in the list of major metropolitan areas in the regional profiles. The same approach applies if you want to look at one county in an MSA that covers six counties. You would have to obtain employment figures or economic factors from local sources.
For instance, to find the number of electrical contractor employees in Addison, Ill., a city not detailed in the East North Central regional profile, you could contact the local Chamber of Commerce, a nearby union chapter, the state university, the state’s department of commerce or the local library to track it down.
These multipliers come in handy if you want to approximate the amount of sales available from a particular account. For example, if a local manufacturer employs 300 people, by applying the multiplier of $695, you would expect the facility to purchase about $208,500 worth of electrical MRO products this year.
Using multipliers results in a dollar figure for market size that tells the level of business electrical wholesalers in the area could do if every potential customer there bought a typical amount of product from them. It tends to be a larger number than actual distributor sales. You can also use EW’s multipliers to track sales through different types of customers over time. Let’s do that for sales through electrical contractors. At the peak of the current business cycle in Oct. 2007, electrical contractors had 943,700 employees, nationally. Using EW’s multiplier of $44,577 in sales for each electrical contractor employee, that’s roughly $42 billion in sales at the market peak. With the drop in employment at electrical contractors to 777,000 as of August data, potential sales slid about 18% to an estimated $34.6 billion.
To help you use our 2014 National Multipliers, Electrical Wholesaling's editors have developed a simple, Excel-based calculator that you can use to plug in your own employment data and develop sales forecasts for key customer segments. Click on the "Download This File" image below or this link to download the calculator.

Summary. 2014 looks like another year of steady if not spectacular growth. It could be a whole lot better if the fiscal fog from the uncertainty over the federal budget lifts and business owners feel confident enough in the economy to increase their capital expenditures in their businesses.
Get it all in Electrical Wholesaling's Digital November Issue. If you like what you see here in the online version of our 2014 Market Planning Guide, you may also want to see a digital version of the entire November issue. It's available for free by clicking here.

About the Author
Jim Lucy
Editor-in-Chief of Electrical Wholesaling and Electrical Marketing
Jim Lucy has been wandering through the electrical market for more than 40 years, most of the time as an editor for Electrical Wholesaling and Electrical Marketing newsletter, and as a contributing writer for EC&M magazine During that time he and the editorial team for the publications have won numerous national awards for their coverage of the electrical business. He showed an early interest in electricity, when as a youth he had an idea for a hot dog cooker. Unfortunately, the first crude prototype malfunctioned and the arc nearly blew him out of his parents' basement.
Before becoming an editor for Electrical Wholesaling and Electrical Marketing, he earned a BA degree in journalism and a MA in communications from Glassboro State College, Glassboro, NJ., which is formerly best known as the site of the 1967 summit meeting between President Lyndon Johnson and Russian Premier Aleksei Nikolayevich Kosygin, and now best known as the New Jersey state college that changed its name in 1992 to Rowan University because of a generous $100 million donation by N.J. zillionaire industrialist Henry Rowan. Jim is a Brooklyn-born Jersey Guy happily transplanted with his wife and three sons in the fertile plains of Kansas for the past 30 years.
Doug Chandler
Senior Staff Writer
Doug has been reporting and writing on the electrical industry for Electrical Wholesaling and Electrical Marketing since 1992 and still finds the industry’s evolution and the characters who inhabit its companies endlessly fascinating. That was true even before e-commerce, LED lighting and distributed generation began to disrupt so many of the electrical industry’s traditional practices.
Doug earned a BA in English Literature from the University of Kansas after spending a few years in KU’s William Allen White School of Journalism, then deciding he absolutely did not want to be a journalist. In the company of his wife, two kids, two dogs and two cats, he spends a lot of time in the garden and the kitchen – growing food, cooking, brewing beer – and helping to run the family coffee shop.