Latest from Market Forecasts

33574911 / khunaspix / DreamsTime
104750065 / Sashkinw / DreamsTime
58217280 © Jakub Jirsak / DreamsTime
Building Market Share Photo 58217280 © Jakub Jirsak Dreamstime
© Jakub Jirsak / DreamsTime
Building Market Share Photo 58217280 © Jakub Jirsak Dreamstime
Getty Images
Market Data Getty Images 952510084 Mf3d

A Look at 2023

Nov. 21, 2022
Leremy / Dreamstime.com
Opener
© Skypixel | Dreamstime.com
Disc 1120 Pr

The Road Ahead

Nov. 18, 2020
104750065 / ashkinw / DreamsTime
opening_photo_mpg_photo_104750065__sashkinw_dreams

2024 Market Planning Guide

Dec. 8, 2023
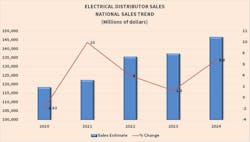
While no one seems to be expecting gangbusters growth in 2024, next year the $146.9-billion electrical wholesaling industry should still see a steady flow of solid business opportunities.

When you dig deeper into economic factors that will have the biggest impact on business conditions in the electrical market, you soon uncover one central challenge that influences most others — inflation.
Inflation seems to be slowly moving in the right direction after rising to levels not seen in decades during and shortly after the COVID shutdown. But if inflation stalls at current levels, the challenges the electrical market is currently having with higher product prices, the slowdown in spending on construction projects or business expansion because of higher borrowing costs, and tough times in the housing market because of higher mortgage costs will continue. The higher interest rates could also tamp down demand for the stocks of publicly held electrical manufacturers, distributors and contractors.

Despite the concerns over inflation, distributor respondents to several recent surveys, as well as most construction industry economists and Wall Street analysts, don’t see a recession in 2024. Nick Lipinski, an equities analyst with Vertical Research Partners (VRP), who manages the quarterly EW/VRP survey on electrical market conditions, says the responses on 2024 demand were mixed. Election noise may impact decision-making in 2024, says Lipinski, but distributor respondents in the Q3 2023 survey agreed projects already underway will be seen to completion. He said that while the survey forecast of +3.3% growth over Q2 2023 (+2.7% volume growth and +0.6% of price) was generally in line or above expectations, several distributors noted a marked slowing in day-to-day activity in October.

“It’s too soon to tell if this is merely a temporary pause or the start of a more meaningful deceleration,” he said. “We have heard in prior quarters about soft spots of a week or two that turned out to just be air pockets in between spurts of still-strong demand.
“Some distributors have also seen a slower quoting environment, though others still see a healthy pipeline related to reshoring and/or stimulus-related investments. Looking forward, distributors are expecting sales down -1.6% on average for Q4 2023, the first anticipated decline since 2020.”
 

MODEST GROWTH IN NONRESIDENTIAL CONSTRUCTION

While Dodge Construction Network is looking at +3% growth in the key nonresidential sector in 2024, the company’s economists still have concerns for future growth because of interest rates and borrowing costs. “Risks continue to mount for the construction sector,” said Richard Branch, chief economist for Dodge Construction Network, in a recent press release. “Over the last 12 months, construction starts have essentially froze as rates increased and credit tightened. The industry needs further adjusting as rates are expected to stay higher for longer, along with the potential for higher energy costs and continued political uncertainty. A return to broad-based growth in construction starts is still some time away.”
In her analysis of the most recent Dodge Momentum Index data, a leading indicator for future construction activity, Sarah Martin, associate director of forecasting for Dodge Construction Network, said in the press release, “Solid demand for data centers, life science labs and hospitals supported the uptick in nonresidential planning activity last month. While month-to-month trends can be volatile, year-to-date trends show an overall decrease in commercial planning, offset by more institutional projects entering the queue. If financial conditions improve in early 2024, steady planning activity should follow.”
Several other construction forecasters issued cautious forecasts for 2024 growth. ConstructConnect said it expects total U.S. construction starts to contract -8.1% in 2023 but return to growth of +2.8% in 2024. ConstructConnect’s Autumn 2023 quarterly forecast said, “Nonresidential building activity is not expected to return to growth in 2024, but levels of construction activity are high relative to historic averages. The medium-term outlook is positive with support from the Inflation Reduction Act (IRA) and the Creating Helpful Incentives to Produce Semiconductors (CHIPS) Act. The bumper growth in 2022 means that the 2023 growth rate will be negative due to large projects falling out of the calculation, while capacity constraints are likely to weigh on activity in 2024, causing a slump of -1.9%.”
The Deloitte consulting firm also sees federal legislation sparking growth in 2024. It said in its 2024 Engineering & Construction Industry Outlook, “Looking ahead to 2024, there could be a boost to construction associated with manufacturing, transportation infrastructure and clean energy infrastructure, as funds from three key pieces of legislation passed in 2021 and 2022 — the Infrastructure Investment and Jobs Act (IIJA), the IRA and the CHIPS Act — are expected to flow into the industry.”
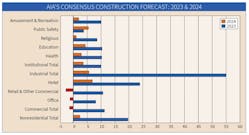
One of the most interesting construction forecasts available is the Consensus Construction Forecast published twice-a-year by the American Institute of Architects. It blends the forecasts for key construction niches from nine leading construction economists at the following companies: Dodge Construction Network, S&P Global Market Intelligence, Moody’s Analytics, FMI, ConstructConnect, Associated Builders & Contractors, Wells Fargo Securities, Markstein Advisors and Piedmont Crescent Capital. AIA’s forecast expect nonresidential construction spending to increase just +2% next year after a +19.7% boost this year, supported in large part by a +55.1% increase in industrial construction spending.

In his July 2023 commentary on the updated 2023 Consensus Construction Forecast, Kermit Baker, AIA’s chief economist said spending on nonresidential buildings has been growing at a “torrid” pace so far this year. “Even with the expected moderation during the second half of the year, the AIA Consensus Construction Forecast Panel is projecting that spending will increase by just under +20% for the year,” he said in his analysis. “That pace of growth hasn’t been seen since the construction boom years leading up to the Great Recession. Leading the charge is the manufacturing sector, where spending is projected to increase more than +50% this year on top of an exceptional performance last year. And while industrial construction spending is expected to be the bright light, healthy gains are expected across the board, with both the commercial and institutional construction categories projected to increase at a double-digit pace.

“However, after the surge this year, market spending growth is expected to come back to earth in 2024. Forecast panelists are calling for a modest +2% increase in overall building spending next year, with a projected modest decline in the commercial sector, a +4% increase in spending on institutional facilities and just a +5% increase in the currently red-hot industrial sector.”
A more recent report from AIA, the AIA/Deltek Architecture Billings Index (ABI), which tracks business for architects, said conditions at architecture firms continued to soften in October. For the third consecutive month, the ABI score was under 50 points, indicating that a significant share of firms is seeing a decline in billings. “This report indicates not only a decrease in billings at firms, but also a reduction in the number of clients exploring and committing to new projects, which could potentially impact future billings,” Baker said in the press release. “The soft conditions were evident across the entire country as well as across all major nonresidential building sectors.” 
Three nonresidential project types that look particularly promising are Electric vehicle plants, semiconductor fabrication facilities and data centers. 
 

HOW TO USE THE MARKET PLANNING GUIDE

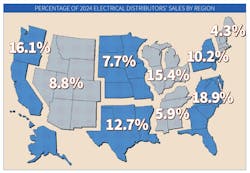
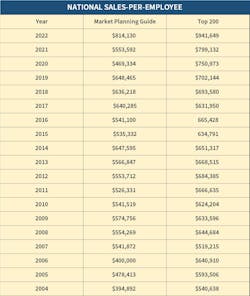
The market planning data in this issue is divided into nine regions of the United States. For each region, you’ll find an economic snapshot of the region and employment statistics for the typical distributor’s two largest customer groups — electrical contractors and manufacturing employees; and sales potential by state and for each region’s largest MSAs. We develop those estimates using sales-per-employee multipliers and employment data published by the U.S. Bureau of Labor Statistics (a three-month average of employment data from July 2023 through Sept. 2023).
By using this forecasting method and accounting for an estimated inflation rate of 2.4% in 2024, EW’s editors believe full-line electrical distributors will sell $144.3 billion worth of electrical supplies next year.

Methodology. Normally, the print edition of our annual Market Planning Guide includes a sales estimate for the next year, as well as some insight into distributors’ anticipated capital expenditures and their expectations for business conditions in key market segments. Unfortunately, this year the response rate for this survey was not high enough at press-time to publish a statistically viable forecast for 2024, so EW’s editors a published the 2024 sales forecast in this article in the first chart. 

Please respond to Electrical Wholesaling’s Market Planning Guide surveys when you see them — filling it out only takes a few minutes and it helps us produce more reliable electrical sales forecasts.
 

DEVELOPING SALES ESTIMATES

When developing any market forecast, gathering some basic data on the size and makeup of the market is the first step. Let’s take a look at some of the ways you can crunch the numbers we’ve provided to tailor them to your business. One of the most common uses of this resource is for developing a business plan, whether it be for internal use as your guide for next year or for a presentation to an investor or banker. You will need something that states the size of the local market, and these sales figures are a documented source you can use “as is.” 
This data will also be helpful in establishing a sales forecast for your company and your region, comparing nearby or far-flung markets with an eye to opening or closing a branch, and evaluating promising areas of new business. One question distributor should ask themselves — and suppliers will be asking — is: “Are our sales into the market at the level they should be?” Look at the estimate for the overall sales in your market in comparison with your company’s sales. 
Employment in major customer markets. In addition to sales forecasts, employment numbers make up a large part of the regional profiles. The number of people employed by a company or in an industry tends to rise and fall with the volume of business it’s doing. Here are some ideas for how to use employment data in your market planning.
Employee counts can help you compare the relative sizes of various end-user groups in your area.
You can also compare the make-up of one market area to another and consider new customer markets or ones that you could be serving better.
If you track the employment figures for each market over time, you’ll see broad economic trends unfolding in your market.
You can also use these employment figures to make your own multipliers, or you can use the national multipliers we’ve already calculated.

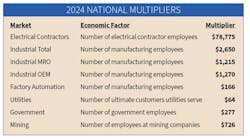
Multipliers. Each multiplier is a dollar figure that represents the average amount of electrical products distributors sell to each particular type of customer, on a per-employee basis or other “economic factor.” (See EW’s National Multipliers in the chart). When used with the employment figures in the regional profiles, the multipliers help establish the amount of business electrical distributors could do with major customer groups in your area and in total. 

For instance, to find the number of electrical contractor employees in Addison, IL, a city not detailed in the East North Central regional profile, you could contact the local Chamber of Commerce, a nearby union chapter, the state university, or the local library to track it down. 
These multipliers come in handy if you want to approximate the number of sales available from a particular account. For example, if a local manufacturer employs 300 people, by applying the multiplier of $1,215, you expect the facility to purchase about $364,500 worth of electrical MRO products this year. 

Using multipliers results in a dollar figure for market size that tells the level of business distributors in the area could do if every potential customer bought a typical amount of product from them. It tends to be a larger number than actual sales.

You can also use EW’s multipliers to track sales through different types of customers over time. For sales to electrical contractors, use EW’s national multiplier of $78,775 for each electrical contractor employee. We are using the same multiplier for contractor and industrial employment as last year. 
Summary. While the overall economic forecast for the industry may call for slower growth in 2024, some individual market sectors and regions of the country will do much better than the low single-digit growth that economists expect for the electrical market.