


")
If you are trying to map out your 2019 forecast right now, it’s easy to get distracted by the noise in the general press that doesn’t always have a heck of a lot to do with how the electrical industry operates.
For instance, at press-time headlines have been screaming about how declines in the stock market are battering 401Ks, even though Wall Street veterans have been expecting a moderate correction for some time and say a shakeout will drive unhealthy speculation from the market. And although the 3Q 2018 data for U.S. GDP says the national growth rate is sitting at a very healthy 3.55% (down from 3.82% in 2Q 2018), it’s expected to drop to 2.64% in 4Q 2018, according to the Federal Reserve Bank of St. Louis. It may continue to decline as the impact of President Trump’s tax wears off.
But other news stories are having a very real impact on this industry, as seen in EW’s September cover story on the impact of the tariffs on construction material pricing. Another economic issue getting a lot of play right now is the slump in home sales because of rising interest rates and the hesitancy or financial inability on the part of Millennials in their prime buying years to purchase their first homes. This story hits closer to home, because residential product sales account for an estimated 15% to 20% of the total market. When homebuilding declines it has a domino effect on the construction of other businesses and services that rely on homeowners, like stores, gas stations, restaurants, medical offices and other light-commercial projects. This niche is big business for many distributors, reps and manufacturers.
WHERE RUBBER MEETS THE ROAD
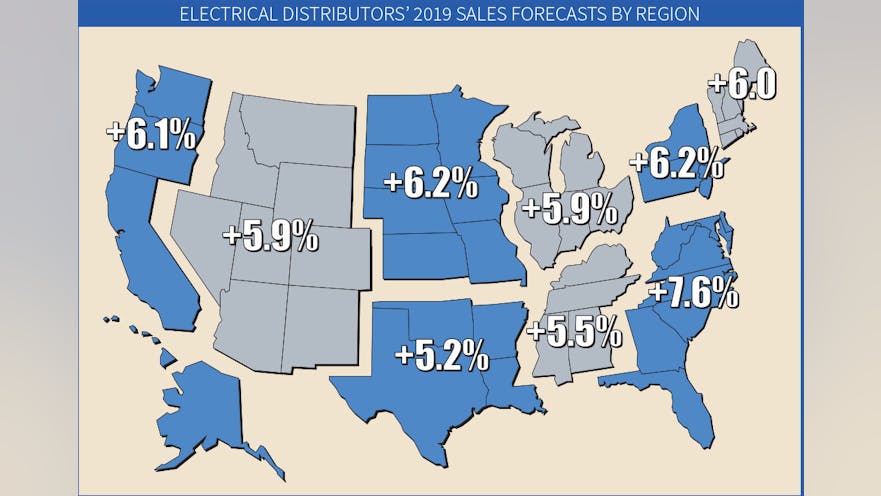
Some conflicting economic signals and forecasts are making it more difficult to peg 2019’s business conditions in the electrical market. The 340-plus distributor respondents to EW’s survey for the 2019 Market Planning Guide expect industry sales to increase +6.1% next year to $114.77 billion after a +5.1% increase in 2018. Our gut feel at EW is that an increase of just over 6% in this economy is about a point high. Our readers have done a great job of providing realistic forecasts over the years, but this year’s number seems a smidge high to us, so use them with due consideration.
EW’s 2019 forecast is +2.6% higher than the 2019 DISC Forecast for +3.5% growth provided by the electrical industry’s leading economist, Herm Isenstein. Check out Herm’s article in this issue for more details about his forecast for next year. The annual sales outlooks EW and DISC provide generally track more closely than what they look like for 2019. It will be interesting to see where the “real number” ends up.
One important economic indicator that continues to scream out “Full Speed Ahead,” is electrical contractor employment, which has been averaging more than 900,000 over the past year, well over the 800,000-level that is the rule-of-thumb indicator of a healthy construction market. That’s an important number for EW readers, because electrical contractors typically account for an estimated 50% of electrical distributors’ sales, and each employee at an electrical contracting firm can generate $66,313 in annual sales, according to EW’s estimates.
The construction scene. Because electrical distributors get a giant chunk of the overall sales from servicing electrical contractors and other end users or buying influences in the nonresidential construction, EW’s editors look for the forecasts from construction industry economists to get their sense of where the market is headed. Two of the most reliable construction forecasters over the years have been Robert Murray, chief economist, Dodge Data and Analytics, and Kermit Baker, chief economist for the American Institute of Architects (AIA), Washington, DC, and publisher of AIA’s Consensus Construction Forecast. Like the 2019 forecasts published by DISC and EW, the Dodge and Consensus Construction Forecasts have some daylight between them. AIA’s forecast, an average of the forecasts of economists from Dodge, ConstructConnect, FMI, IHS Global Insight, Associated Builders & Contractors, Wells Fargo and Moody’s Analytics, calls for +4% growth in total nonresidential construction, while Murray sees no growth in this important niche next year. Another interesting fact with the AIA Consensus Forecast is that the seven economists presented forecasts ranging from Dodge’s call for a flat market all the way up to FMI’s expectations of +6.3% growth.
Back in July, Kermit Baker said in the release accompanying AIA’s most recent consensus construction forecast, “Given that we’re halfway through the seventh year of continuous growth for this notoriously cyclical industry, 2018 might have looked to be the year that the industry would enter another recession. However, when polled at the beginning of this year, the AIA Consensus Construction Forecast Panel instead saw an acceleration in activity, projecting +4% growth in 2018 and a nearly equal +3.9% in 2019.
“At the halfway point of the year, this panel is even more optimistic. Their forecasts have been marked up to +4.7% growth in spending for this year and an additional +4% in 2019. If these projections materialize, by the end of next year the industry will have seen nine years of consecutive growth, and total spending on nonresidential buildings will be +5% greater (ignoring inflationary adjustments) than the last market peak of 2008.”
At the 2019 Dodge Construction Outlook in National Harbor, MD, Murray was not at all pessimistic about the fortunes of the construction market even though he is forecasting a no-growth scenario for total construction next year. His take is that the market is “rounding the peak” of the current construction cycle, and said, “When the downturn ultimately comes, it won’t be a replay of 2008… Fundamentals continue to be sound.”
“Over the past three years, the expansion for the U.S. construction industry has shown deceleration in its rate of growth, a pattern that typically takes place as an expansion matures,” he said in a Dodge press release. “After advancing 11% to 14% each year from 2012 through 2015, total construction starts climbed 7% in both 2016 and 2017, and a +3% increase is estimated for 2018.
“There are, of course, mounting headwinds affecting construction, namely rising interest rates and higher material costs, but for now these have been balanced by the stronger growth for the U.S. economy, some easing of bank lending standards, still healthy market fundamentals for commercial real estate, and greater state financing for school construction and enhanced federal funding for public works.”
When giving his 2019 forecast at the 2019 Dodge Outlook for the overall economy, Cris deRitis, senior director, Economics, & head of Consumer Research for Moody’s Analytics, said he sees a soft landing followed by a “garden variety” relatively short recession of about a year, possibly starting in 2Q 2020.
Hot markets. These national-level forecasts set the stage for the overall expectations at the 35,000-foot level for the U.S. economy, but you need to drill down to the local markets to see what’s really happening on the street level. It’s always a different story from region-to-region and market-to-market, but this year perhaps more than any other in recent memory, the differences between local trading areas seem particularly huge. For instance, the overall national expectations for the housing market are for some softening — unless you live in Florida; South Carolina’s biggest metros; or in cities like Phoenix, Colorado’s Front Range, Salt Lake City, Las Vegas, Reno, Dallas, Houston, Austin and San Antonio. Single-family construction is tracking at a double-digit rate over 2017 in these areas. Many of these markets are seeing a huge influx of new residents, while rural regions of the country like upstate New York, rural Pennsylvania and some high-tax areas like Connecticut are losing population.
And while the commercial construction scene has been healthy in dozens of metros across the United States, as you will see in the capsule regional summaries on the following pages, cities like Boston, New York, Charlotte, Washington, DC, Miami, Austin, Dallas, San Francisco, San Diego, San Jose and Seattle are racing far past other markets that don’t have as strong of a technology base or aren’t attracting residents because of a warmer climate or other desirable lifestyle amenities. These cities also seem to have a bigger share of some of the fastest-growing project types, including data centers, rail/mass transit, Amazon warehouses, airports and sports facilities.

HOW TO USE THE MARKET PLANNING GUIDE
The market planning data in this issue is divided into nine regions of the United States. For each region, you’ll find sales forecasts for this year and next year, along with the three prior years’ sales. In addition to the sales forecasts, prepared by EW’s research department, you’ll also find an economic snapshot of the region and employment statistics for the typical distributors’ two largest customer groups — electrical contractors and manufacturing employees.
Methodology. Our forecasts are based upon responses to EW’s annual Market Planning Guide (MPG) survey. Each year, the magazine asks electrical distributors for their previous year’s final sales results, sales predictions for the current year, and predictions for the following year. It also asks respondents how sales for the first six months of the current year compared with the first six months of the previous year.
We mailed 5,744 (both by mail and via e-mail) and received more than 340 usable responses for a 6.1% response rate. Respondents reported a mean sales-per-employee number of $640,285 for 2017, up from $541,000 in 2016. Regional sales-per-employee numbers are provided on page 16. Be sure to check how your company’s productivity compares with the national and regional averages when it comes to sales-per-employee.
A note on our national sales base number. The base sales number for our national sales forecast comes from the Census of Wholesale Trade that the Commerce Department sends out every five years. Data from the most recent survey in 2012 was finally available in 2015 for the category that most closely defines our electrical market —“NAICS: 423610 - Electrical apparatus and equipment, wiring supplies, and related equipment merchant wholesalers” (specifically “Merchant wholesalers, except manufacturers’ sales branches and offices”).
The U.S. Commerce Dept. has a very broad definition of an electrical distributor, and its most recent data shows 13,789 branch locations run by electrical distributors. EW’s editors don’t believe that number is accurate because it’s more than double what EW’s editors have been able to verify for what most industry execs would consider to be distributors of electrical supplies.
With such a huge branch count, the Census Dept. estimate for total industry sales isn’t realistic either, and we worked with Herm Isenstein, president, DISC Corp., Orange, Conn., the electrical market’s leading economist, to develop a base sales estimate for 2012 of $86.5 billion. Electrical Wholesaling’s sales estimates will use this base national sales number until the next Census of Wholesale Survey trade is published, most likely in 2020.
EW’s editors will “bring forward” that number for an annual national sales forecast each year using the same survey methodology that Andrea Herbert, Electrical Wholesaling’s late chief editor, first developed in the 1970s for the Market Planning Guide.
DEVELOPING SALES ESTIMATES
When developing any market forecast, gathering some basic data on the size and makeup of the market is the first step. Let’s take a look at some of the ways you can crunch the numbers we’ve provided to tailor them to your business.
One of the most common uses of this resource is for developing a business plan, whether it be for internal use as your guide for next year or for a presentation to an investor or banker. You will need something that states the size of the local market, and these sales figures are a documented source you can use “as is.”
This data will also be helpful in establishing a sales forecast for your company and your region, comparing nearby or far-flung markets with an eye to opening or closing a branch, and evaluating promising areas of new business. One question distributors should ask themselves — and suppliers will be asking — is: “Are our sales into the market at the level they should be?” Look at the estimate of the overall sales in your market in comparison with your company’s sales.
Employment in major customer markets. In addition to sales forecasts, employment numbers make up a large part of the regional profiles. The number of people employed by a company or in an industry tends to rise and fall with the volume of business it’s doing. Employment figures, therefore, act as a gauge to business prospects and conditions in end-user markets.
- Employee counts can help you compare the relative sizes of various end-user groups in your area.
- You can also compare the make-up of one market area to another, and consider new customer markets or ones that you could be serving better.
- If you track the employment figures for each market over time, you’ll see broad economic trends unfolding in your market.
- You can also use these employment figures to make your own multipliers or you can use the national multipliers we’ve already calculated.
Multipliers. Each multiplier is a dollar figure that represents the average amount of electrical products distributors sell to each particular type of customer, on a per-employee basis or other “economic factor.” (See Electrical Wholesaling’s National Multipliers on slide 5). When used with the employment figures in the regional profiles, the multipliers help establish the amount of business electrical distributors could do with major customer groups in your area, and in total.
For instance, to find the number of electrical contractor employees in Addison, Ill., a city not detailed in the East North Central regional profile, you could contact the local Chamber of Commerce, a nearby union chapter, the state university, or the local library to track it down.
These multipliers come in handy if you want to approximate the amount of sales available from a particular account. For example, if a local manufacturer employs 300 people, by applying the multiplier of $789 you would expect the facility to purchase about $236,700 worth of electrical MRO products this year.
Using multipliers results in a dollar figure for market size that tells the level of business distributors in the area could do if every potential customer there bought a typical amount of product from them. It tends to be a larger number than actual distributor sales.
You can also use Electrical Wholesaling’s multipliers to track sales through different types of customers over time. Let’s do that for total U.S. sales to electrical contractors. Using Electrical Wholesaling’s national multiplier of $66,313 in sales for each electrical contractor employee and contractor employment through August of 939,767, that’s roughly $62.32 billion in sales.
Summary. All things considered, EW’s editors see a green light for growth in the electrical wholesaling industry next year. It might not be the +6.1% growth that our optimistic survey respondents are forecasting for 2019, but it should be decent growth, if a bit slower than last year. There’s some cause for concern as we head around the next bend into 2020, but depending on your region of the country and mix of business, 2019 should be a decent if not great year.
