It's safe to say that most distributors, manufacturers, reps and end users are disappointed with the pace of the U.S. economic recovery. The good news is we didn't fall into a double-dip recession and that while 2012 may be a year of slow growth for most electrical firms, it could be some very profitable growth. The recession forced businesses to do more with less, and business owners had no choice but to run their companies lean. As business picks up, companies may be able to pick up new orders at much higher margins than in the recent past.
The bad news is that it's hard to be overly optimistic about 2012's business prospects because of concerns about the budget debacle in Washington, D.C., Europe's economic mess, and a skittish stock market. The economic indicators in the following pages paint a picture of an economy slowly improving. Many of the data points with the most impact on the electrical market have bounced off the bottoms they experienced during the recession but are struggling to gain momentum, with the possible exception of the industrial market, which has weathered the economic storms better than the housing or nonresidential construction markets.
In last year's National Factbook, Electrical Wholesaling's editors pegged the industrial MRO and lighting retrofit markets as the best bets for growth. We haven't changed that evaluation in this year's edition. And we can't say that any big-time business opportunities have surfaced in the residential, commercial, institutional or utility markets, although pockets of growth are starting to pop up in the homebuilding markets, and some electrical companies will have some pretty major downtown redevelopment projects or data centers breaking ground in their backyards. Some truly massive utility-scale photovoltaic projects and wind farms are in full swing right now, but concerns about if the federal financial incentives that have fueled much of this growth will be cut in the budget discussion have clouded the growth prospects for some other solar and wind projects that had been on the drawing boards.
The data in this article will prove more valuable than the general economic forecasts you find in the business pages of most newspapers, because the papers focus more on retail sales, consumer spending and macroeconomic information rather than on data that directly affects the electrical market.
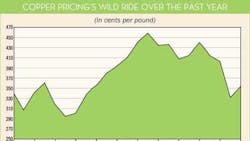
Copper Prices
Even industry veterans who have spent a lifetime selling wire and cable can’t really get a fix on which way copper is headed from year-to-year. It’s not likely to touch the historical range of 60 cents per pound to $1.30 per pound where it spent so much time before topping $3 per pound in 2006 and never looking back. In fact, the $3 level seems to have become the floor in the “new normal” for copper pricing. Other than a brief visit this past June, prices haven’t dipped below $3 per pound since 4Q 2009. Source: U.S. Geological Survey, MetalsWeek and www.metalprices.com
National Office Vacancy Rates
When looking at office vacancy rates, it’s all about the local numbers, because the data can change so much from the suburbs to downtown and even block-to-block in a city. McGraw-Hill Construction and Grubb & Ellis both say office vacancy rates have probably bottomed out, and McGraw-Hill expects the total contract value of new office construction to increase 5% next year to $17.35 billion. That definitely offers some reason for optimism, but it’s still a pretty bleak picture right now for office construction — 20 cities have downtown vacancy rates topping 20%. Source: Grubb & Ellis
Electric Utilities
Construction of new generating plants and updating existing infrastructure has been big news in the past few years, thanks to the development of solar power plants, wind farms and the smart grid. While these technologies are expected to grab the headlines again in 2012, McGraw-Hill expects utility construction to decline 24% in 2012 to 32 billion after registering gains of +34% and +48% in 2010 and 2011, respectively. The largest project expected to break ground next year is FPL’s $1.3 billion natural gas plant in Florida. Source: McGraw-Hill’s 2012 Construction Outlook
Purchasing Managers Index
As a measure of the appetite that industrial purchasing managers have for new products, the monthly Purchasing Managers Index is one of the most closely watched economic indicators in the manufacturing arena. It started strong in 2011 with several months scoring in the 60-point range — comfortably above the 50-point mark that indicates a healthy purchasing environment in the industrial market — but dropped about 10 points since April because of concerns about the slow U.S. economic recovery, the European economic mess and a double-digit recession. Source: Institute for Supply Management
Electrical Contractor Sales Potential
About the Author
Jim Lucy
Editor-in-Chief of Electrical Wholesaling and Electrical Marketing
Jim Lucy has been wandering through the electrical market for more than 40 years, most of the time as an editor for Electrical Wholesaling and Electrical Marketing newsletter, and as a contributing writer for EC&M magazine During that time he and the editorial team for the publications have won numerous national awards for their coverage of the electrical business. He showed an early interest in electricity, when as a youth he had an idea for a hot dog cooker. Unfortunately, the first crude prototype malfunctioned and the arc nearly blew him out of his parents' basement.
Before becoming an editor for Electrical Wholesaling and Electrical Marketing, he earned a BA degree in journalism and a MA in communications from Glassboro State College, Glassboro, NJ., which is formerly best known as the site of the 1967 summit meeting between President Lyndon Johnson and Russian Premier Aleksei Nikolayevich Kosygin, and now best known as the New Jersey state college that changed its name in 1992 to Rowan University because of a generous $100 million donation by N.J. zillionaire industrialist Henry Rowan. Jim is a Brooklyn-born Jersey Guy happily transplanted with his wife and three sons in the fertile plains of Kansas for the past 30 years.
