2017 West North Central Region Forecast
Oct. 28, 2016
2 min read
Iowa . Kansas . Minnesota . Missouri . Nebraska
North Dakota . South Dakota
Several sizeable projects broke ground this year in this region and one mega-project is in the early planning stages in Omaha, Neb., a $1.2 billion mixed-use development being considered near Boys Town. The other larger projects now underway or under consideration include a proposed $500 million addition to the Des Moines airport; a $128.9 million renovation of Minneapolis’ Target Center Arena; the construction of a $60 million training center for the NHL’s Minnesota Wild hockey team in St. Paul, Minn.; a $125 million pipe mill in Norfolk, Neb.; and a $80 million warehouse in St. Peters, Mo. CBRE Research’s data for several of the region’s largest cities also points toward a sluggish climate for office construction, with the downtown office vacancy rates for Minneapolis (14.1%), St. Louis (26.7%) and Kansas City (16.5%) all squarely above the national average of 10.5% in 2Q 2016.
Key Economic Indicators
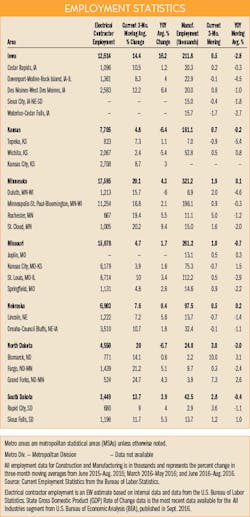
Need a quick read on the economic health of the key metros in this region? Just click on the region's largest Metropolitan Statistical Areas (MSAs) outlined in red. Once the pop-up window you can use the vertical scroll bar to see statistics on local Construction & Manufacturing Employment; building permits; unemployment and population growth.
West North Central Projects in the Pipeline
Want to seem or projects that are either underway or on the drawing boards in the West North Central Region? Just click on the markers in the map below. You can also zoom in on regions of interest or grab the map and move it for a better look at the areas you want.
About the Author
Sign up for our eNewsletters
Get the latest news and updates
Sponsored
Sponsored

