2020 Market Planning Guide
There appears to be several distinct schools of thought on the electrical wholesaling industry’s 2020 business climate. You have the bears who see us just a few quarters away from a recession, but within that tribe, there’s disagreement over just how severe or long the recession might be.
The more optimistic view is that the 2020 U.S. economy won’t get whacked as badly as initially expected by a bad brew of economic drivers like the trade war with China; affordability issues confronting first-time home buyers now dragging down demand for single-family homes; and a downturn in the stock market after it spent parts of 2019 dancing near records for the Dow Jones Index and S&P 500 Index and then declining sharply on negative economic news.
Some industry observers have more of a middle-of-the-road take on the electrical market’s 2020 economic fortunes and see a point or two of growth for the electrical market. In this camp is Christian Sokoll, president, DISC Corp., who is calling for 2020 growth of +1.87%.
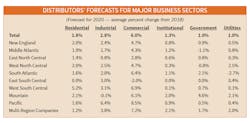
This year, their forecasts for 2020 nonresidential construction, one of the most important drivers of the electrical economy, mark a fairly wide channel of slow growth from -0.4% to +4.4%, and AIA blended their forecasts for a 2020 consensus nonresidential forecast of +2.4% growth. Their forecasts for the closely watched industrial market show an even wider channel of from +0.1% to +9.1% growth, with AIA’s consensus forecast for this segment coming in at +3.3% growth for next year. ConstructConnect’s +9.1% industrial forecast at the high end was an outlier, as the other forecasts are much closer to the AIA consensus forecast for this segment. It’s interesting to note that EW’s 2020 forecast for the electrical wholesaling industry’s industrial segment is for +2.8% growth, right in the middle of the economists’ forecasts.
“The recovery in construction starts that began during 2010 in the aftermath of the Great Recession is coming to an end,” said Richard Branch, chief economist for Dodge Data & Analytics, in the press release. “Easing economic growth driven by mounting trade tensions and a lack of skilled labor will lead to a broad based, but orderly pullback in construction starts in 2020. After increasing +3% in 2018, construction starts dipped an estimated -1% in 2019 and will fall -4% in 2020.
“Next year, however, will not be a repeat of what the construction industry endured during the Great Recession. Economic growth is slowing but is not anticipated to contract next year. Construction starts, therefore, will decline but the level of activity will remain close to recent highs. By major construction sector, the dollar value of starts for residential buildings will be down -6%, while starts for both nonresidential buildings and nonbuilding construction will drop -3%.”
Additional details from this Dodge release are as follows:
- The dollar value of single-family housing starts will be down -3% in 2020 and the number of units will also lose -5% to 765,000 (Dodge basis). Affordability issues and the tight supply of entry level homes have kept demand for homes muted and buyers on the sidelines.
- Multi-family construction was an early leader in the recovery, stringing together eight years of growth since 2009. However, multi-family vacancy rates have moved sideways over the past year, suggesting that slower economic growth will weigh on the market in 2020. Multi-family starts are slated to drop -13% in dollars and -15% in units to 410,000 (Dodge basis).
- The dollar value of commercial building starts will retreat -6% in 2020. The steepest declines will occur in commercial warehouses and hotels, while the decline in office construction will be cushioned by high value data center construction. Retail activity will also fall in 2020, a continuation of a trend brought about by systemic changes in the industry.
- In 2020, institutional construction starts will essentially remain even with the 2019 level as the influence of public dollars adds stability to the outlook. Education building and health facility starts should continue to see modest growth next year, offset by declines in recreation and transportation buildings.
- The dollar value of manufacturing plant construction will slip -2% in 2020 following an estimated decline of -29% in 2019. Rising trade tensions has tilted this sector to the downside with recent data, both domestic and globally, suggesting the manufacturing sector is in contraction.
- Public works construction starts will move +4% higher in 2020 with growth continuing across all project types. By and large, recent federal appropriations have kept funding for public works construction either steady or slightly higher — translating into continued growth in environmental and transportation infrastructure starts.
- Electric utilities/gas plants will drop -27% in 2020 following growth of +83% in 2019 as several large LNG export facilities and new wind projects broke ground.
Hot Markets
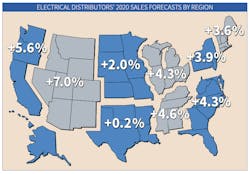
While national forecasts provide a good general reference point, of much more importance is what’s happening on the ground in local market areas with the different types of construction projects. EW’s editors have noticed that the differences in regional economies seem to be getting wider every year. It’s not exactly news that many of the nation’s fastest-growing local markets, including Charlotte and Raleigh-Durham, NC; Atlanta; most of Florida’s metros; Colorado’s Front Range from Colorado Springs north through Denver, Boulder and Fort Collins; Phoenix, AZ; Salt Lake City; and all of Texas’ major metros are in the Sunbelt or Mountain states, or that a relatively small handful of cities account for a huge amount of the nation’s overall commercial construction.
Over the past few years, EW has reported on the enormous amount of office, mixed-use, multi-family and other commercial construction in cities including Boston; New York; Washington, DC; Chicago; Los Angeles; San Francisco; San Diego; and Seattle. Houston, Dallas-Fort Worth and Austin, TX, have had a huge impact on the office market, according to a post on www.bisnow.com about a report recently published by the CoStar real estate consulting firm. According to that post, “Texas’ top three office markets — Houston, Dallas-Fort Worth and Austin — housed roughly 104 million sq ft of the 430 million sq ft of new U.S. office space that came online during the last decade, CoStar data shows. In totality, Dallas-Fort Worth, Austin and Houston accounted for 24% of the nation’s new office construction pipeline during the 10-year span running from 2009 onward.”
Popular project types. You also see some definite trends in the types of projects powering the construction market, particularly in the commercial and industrial markets, and we report on many of them in the Regional Factbook . Mixed-use downtown redevelopment projects, data centers, airport new construction and renovation, LNG (liquid natural gas) and chemical plants along the Texas-Louisiana Gulf Coast, college and university construction and light-rail/mass transit projects are most common.
HOW TO USE THE MARKET PLANNING GUIDE
EW's online version of its Annual Market Planning Guide is divided into nine regions of the United States. For each region, you’ll find sales forecasts for this year and next year, along with the three prior years’ sales. In addition to the sales forecasts, prepared by EW’s research department, you’ll also find an economic snapshot of the region and employment statistics for the typical distributors’ two largest customer groups — electrical contractors and manufacturing employees.
The online version also includes information on some of the largest construction projects underway and a link to a digital version of EW's November issue.
A note on our national sales base number. The base sales number for our national sales forecast comes from the Census of Wholesale Trade that the Commerce Department sends out every five years. Data from the most recent survey in 2012 was finally available in 2015 for the category that most closely defines our electrical market — “NAICS: 423610 - Electrical apparatus and equipment, wiring supplies, and related equipment merchant wholesalers” (specifically “Merchant wholesalers, except manufacturers’ sales branches and offices”). Although the Commerce Dept. recently published its national numbers for its definition of a distributor of electrical supplies, EW will not use this number as a base for its sales estimates until the Commerce Dept. also publishes its product sales data, which won’t be available until Nov. 2020. EW’s editors need the product data to refine the Commerce Dept.’s sales estimates for electrical wholesalers.
When the 2012 Census of Wholesale Trade came out, we worked with Herm Isenstein, founder, DISC Corp., Orange, Conn., to develop a base sales estimate for 2012 of $86.5 billion. EW’s sales estimates will use this base national sales number until the product data for the next Census of Wholesale Survey is available. EW’s editors will “bring forward” that number for an annual national sales forecast each year using the same survey methodology that Andrea Herbert, EW’s late chief editor, first developed in the 1970s for the Market Planning Guide.
DEVELOPING SALES ESTIMATES
When developing any market forecast, gathering some basic data on the size and makeup of the market is the first step. Let’s take a look at some of the ways you can crunch the numbers we’ve provided to tailor them to your business.
One of the most common uses of this resource is for developing a business plan, whether it be for internal use as your guide for next year or for a presentation to an investor or banker. You will need something that states the size of the local market, and these sales figures are a documented source you can use “as is.”
This data will also be helpful in establishing a sales forecast for your company and your region, comparing nearby or far-flung markets with an eye to opening or closing a branch, and evaluating promising areas of new business. One question distributors should ask themselves — and suppliers will be asking — is: “Are our sales into the market at the level they should be?” Look at the estimate of the overall sales in your market in comparison with your company’s sales.
Employment in major customer markets. In addition to sales forecasts, employment numbers make up a large part of the regional profiles. The number of people employed by a company or in an industry tends to rise and fall with the volume of business it’s doing. Employment figures, therefore, act as a gauge to business prospects and conditions in end-user markets.
- Employee counts can help you compare the relative sizes of various end-user groups in your area.
- You can also compare the make-up of one market area to another, and consider new customer markets or ones that you could be serving better.
- If you track the employment figures for each market over time, you’ll see broad economic trends unfolding in your market.
- You can also use these employment figures to make your own multipliers or you can use the national multipliers we’ve already calculated.
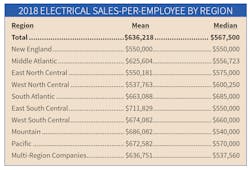
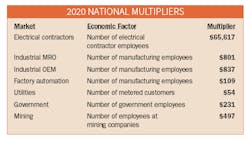
Electrical Wholesaling's 2020 Sales-per-Employee Multipliers. Each multiplier is a dollar figure that represents the average amount of electrical products distributors sell to each particular type of customer, on a per-employee basis or other “economic factor.” Our multipliers for the electrical market are shown in the box below. When used with the employment figures in the regional profiles, the multipliers help establish the amount of business electrical distributors could do with major customer groups in your area and in total.
For instance, to find the number of electrical contractor employees in Addison, IL, a city not detailed in the East North Central regional profile, you could contact the local Chamber of Commerce, a nearby union chapter, the state university, or the local library to track it down.
You can also use EW’s multipliers to track sales through different types of customers over time. Let’s do that for total U.S. sales to electrical contractors. Using EW’s national multiplier of $65,617 in sales for each electrical contractor employee and the 3-month moving average for electrical contractor employment through August of 972,300, that’s roughly $63.8 billion in sales.
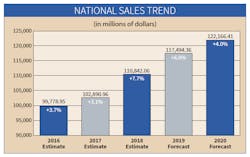
Summary. Despite our forecast for +4% growth next year, proceed with caution in this market environment. While the most recent forecast data we have seen definitely points toward a slow-growth environment rather than a dramatic downturn, your take on the market will largely depend on your business mix and region of the country. 2020 could be the start of some sluggish growth, but if you survived the 2008-2009 Great Recession, you won’t have any trouble managing your way through a slower growth cycle.

