2020 was unnerving at best and devastating at worst. The onslaught of the COVID-19 pandemic resulted in unprecedented sickness, job loss, societal shutdown and, sadly for many, death. Fortunately, our industry was deemed essential by the Cybersecurity and Infrastructure Security Agency at the beginning of the pandemic and continues to be critical to our country’s economic viability. Without the uninterrupted ability to build, maintain and repair electrical systems that power, control, measure and communicate our daily activities, we would likely be in a far worse business state.
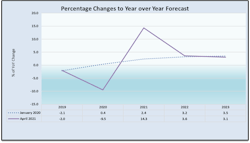
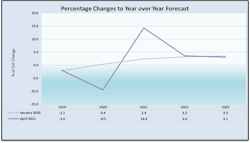
As the broad recovery continues for the verticals we serve — construction, industrial, institutional and utilities – inflationary price pressures are obfuscating true performance. Looking back at January 2020, we were forecasting that our industry maintains a modest and regular growth pace through 2023. Then the pandemic entered the picture, and the estimate for the overall electrical distribution marketplace for 2020 fell quickly behind 2019 year-over-year (YOY) performance by -9.5%. Our 2021 April forecast is for robust +14.3% YOY growth. Looking at these numbers without any larger context, it’s tempting to think that 9.5% subtracted from 14.3% means that we are effectively showing +4.8% growth over the pre-pandemic numbers, as illustrated in the following graph. However, this can be deceptive because the inflationary price bounce is absorbing a large portion of the growth gain. Just because you are selling more dollars doesn’t mean that you’re making more money or selling more stuff. As an example, 500 pounds of copper today is worth about what 1,000 pounds was at this time last year. It’s all about current pricing and inventory valuation.
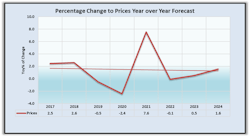
The impact of prices. For the April 2021 outlook, the 2020 price shows a YOY decrease of -2.4% from 2019 levels. Conversely, the current 2021 forecast has prices rising +7.6% YOY. In a broad sense, prices are moving higher as demand continues to improve, and supply is unable to keep up the pace. Using the same logic as the forecast above, subtracting the 2020 drop from the 2021 rise (7.6% minus 2.4%) leaves us a +5.2% price increase over the pre-pandemic price levels, as shown in the following graph.
This number correlates to a large extent to the forecast growth. Why not one-to-one? If we used the one-to-one logic, our sales would actually be off from pre-pandemic by the difference between sales growth and price inflation. The often-forgotten factor is preexisting inventory selling at cost-plus without concern for replacement value, driving higher velocity sales, meaning price now is not the same as price before and should not be treated as such.
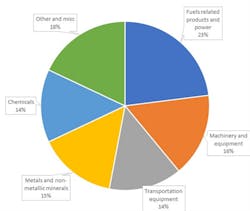
Pricing as a component of the DISC forecast. While many factors impact prices, we identify three main causes for the current price increases: Supply chain disruption, commodity inflation and employment. COVID remains problematic in many parts of the world impacting imports. Jobs are going unfilled – truckers, dock workers, warehouse workers, factory workers and people not going back to work to stay home with children. Economically, we cannot keep up with demand because companies are unable to fill the open positions. To complicate this, commodity prices have been climbing at a very brisk pace. The following pie chart shows the components and percentages of the commodities and equipment that comprise DISC price forecasts.
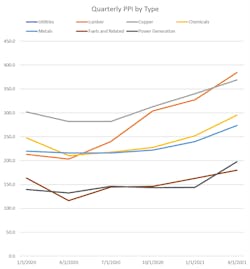
The graph below illustrates the impact of the current inflationary cycle on key commodities in our forecast.
The current inflationary cycle impacts more than our industry. The Consumer Price Index (CPI) is up +4.2% from one year ago. We have not seen an increase like this since September 2008. During that year, energy costs increased +29.3% annualized, mostly fuel oil and gasoline, which contributed to this bump. To moderate inflation, the government can deploy wage and price controls. Another option is contractionary monetary policy that reduces demand by curtailing the supply of money through increases in interest rates and decreases in bond prices. We are beginning to see wage and price controls through new tax and employment policy. Changes to monetary policy and the Federal Funds rate (currently 0.00% - 0.25%) are not far behind.
The key takeaway from this article is to protect your below-market owned inventory by pricing to current market (replacement cost). Understanding the economic recovery and the upswing in sales being driven by prices is also an important consideration. Lastly, remember to keep the rainy-day fund flush as interest rates on credit facilities (loans, investor cash infusions, long- and short-term debt, etc.) may soon be used as an inflationary control measure.
Christian Sokoll is president of DISC Corp., Houston, the electrical market’s leading provider of sales forecasts and related market data. He can be reached at [email protected] or 346-339-7528.
About the Author
Christian Sokoll
Meet Chris Sokoll
Chris began his career in the electrical industry 30 years ago in Spokane, WA, in the way so many in the electrical wholesaling space have – working the counter and the phones. He relocated to Phoenix, Arizona, and continued his career progression in an inside sales role with King Wire covering the Southwest. His next stop was Atlanta, where he continued to learn the business and worked the Southeast region. Little did Chris know that a move back to Washington state would start a career with Houston Wire & Cable that would span nearly three decades.
Chris was named “New Salesperson of the Year” in 1991 for his outstanding results and won additional awards for sales growth by supporting oil and gas exploration in the North Slope and managing a joint contract with Boeing. He progressed in his career taking an outside sales position in Lexington, KY, working with electrical distribution business development on major corporate accounts such as Mead Paper, DOW / Dupont, and the Savannah River Project. Chris was promoted to Regional Manager over the Southeast and again proved himself by significantly growing both sales and profitability.
Chris was asked to take on a turnaround project for Houston Wire & Cable’s Midwest Region, headquartered in the Chicago metro area, where he nearly tripled the region’s sales – from $24 million to $74 million. During his tenure in Chicago, Chris won numerous management and vendor awards for new product rollouts, sales growth, and national account management. His team won more “President’s Circle” sales awards than any of the other 11 Houston Wire & Cable locations. This high level of performance resulted in Chris earning a position as Regional Vice President.
Chris’s next stop was as Division President for Southern Wire, a heavy lift equipment wholesale subsidiary of Houston Wire & Cable based near Memphis, TN. He took this position post-acquisition and integrated the division, managed a transition of computer systems, and developed a segmented market plan while retaining all employees. Chris was able to buy out a competitor’s inventory, resulting in their exit from the market, and then hired their VP of Sales to step in as President of Southern Wire. This facilitated Chris’s next role as Corporate VP of National Business Development based in Houston, where his first responsibilities included continued oversight of Southern Wire, managing the Cable Management Services Project Group, and directing the National Service Center, a training and development group for new sales professionals entering the industry.
During this time overseeing so many critical divisions, Chris became more immersed in business intelligence and market data analysis – leading to innovative internal changes at Houston Wire & Cable. Chris learned to use and blend data from multiple sources such as DISCCORP, Industrial Information Resources (“IIR”), and ERP and CRM data to aid the company in embracing data and visualization tools in a completely new and unprecedented fashion. Chris deployed industry-leading corporate analytics and business intelligence tools such as Tableau, Power BI, Alteryx, Access, and Excel to inform and improve decisions and track KPIs. Likewise, he provided reporting for the board of directors and senior management team both in spreadsheets and in various advanced visual presentation formats. Chris also designed, tracked and approved compensation programs for sales reps and agents, and was also instrumental in the design and tracking of customer rebate programs.
In 2019, after working closely with DISC Corp. as a customer for five years and thus seeing the ongoing need for quality market intelligence data for the industry, Chris left Houston Wire & Cable to purchase DISC Corp. from its founder, Herm Isenstein. Along with being the leading economist in the electrical market for more than 30 years through his work at DISC, Herm was also a prolific author for Electrical Wholesaling magazine.
Herm passed away in Sept. 2019, but Chris continues to grow DISC’s vision while maintaining its leadership position as a trusted data source. By diligently working alongside DISC Corp.'s economists, programmers, and marketers, Chris embraces his passion to ensure that DISC continues delivering high-quality business intelligence and forecasting to further the future of the electrical wholesaling industry.
Chris holds a bachelor’s degree in organizational leadership from Roosevelt University in Chicago and a graduate certificate in finance from the University of Chicago. Chris has completed various Microsoft training programs in Excel and Access in addition to data science theory, and he has written college-level course material on Microsoft Power BI and Excel.
