
It’s tougher than usual to get a good read on economic conditions. Economists can’t seem to agree if the economy is headed for a recession, and if there is a recession, how bad it might be. Folks are tired of COVID restrictions, angry about inflation and frustrated by supply chain woes. Add in concerns about the war in Ukraine, and the fact that three years ago no one was expecting a pandemic, inflation supply chain snafus or a war, and it’s easy to see why economic forecasts are all over the place.
While legitimate concerns exist about a national or global recession, local market areas often run counter to the pace of the national economy and will often do much better — or worse. Economic data at the 35,000-foot level is important to get a sense of the overall direction of the U.S. economy and is an important point of comparison for local markets to see if they are beating or lagging the national growth averages for the same economic metrics.
National economic indicators like retail spending and the Consumer Price Index are big factors in the overall health of the U.S. economy. But the electrical market is somewhat insulated from their influence and is shaped by other factors, like construction spending, capital spending, housing starts and employment trends at electrical contractors and industrials. These two market verticals that typically account for at least 75% of all electrical products sold through electrical distributors.
This two-part article will help you track what’s happening in your local electrical market. This month’s feature will discuss the key local market indicators to watch, and the article in the September/October issue will highlight Electrical Wholesaling’s picks for the 10 hottest local markets to watch in 2023.
METRICS THAT MATTER
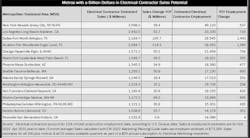
The most important local market data to watch includes the change year-over-year in electrical sales potential; the number of people employed by electrical contractors or industrial companies in the local markets; and trends in residential housing construction and population growth.
The U.S. government provides free monthly data for several key measures that will prove helpful in this endeavor:
- Electrical contractor employment
- Industrial employment
- Building permits
- Population growth
The good news is that this data is available, and it’s free. The bad news is that it’s always at least a few months old, so in some ways you’re looking at a local market area in the rear-view mirror to see where it has been. If you need forecast data for local markets looking out a few years, you can purchase it from Chris Sokoll, president, DISC Corp. (www.disccorp.com).
Electrical Contractor Employment
The U.S. Census Bureau only publishes monthly employment data for electrical contractors at the national level, but you use the monthly construction employment data to get a fair estimate. Over the past two decades, electrical contractors have average 13% of total construction employment. Multiply that number for the local market of interest by EW’s sales-per-employee multiplier and you have a workable estimate for electrical contractor sales potential in that market.
Industrial Employment
You can use this data in the same manner as the electrical contractor data by plugging in EW’s $2,006 sales-per-employee multipliers for the industrial market. The MSAs with the most industrial employees are the Los Angeles-Long Beach-Anaheim, CA MSA with 467,967 employees; Chicago-Naperville-Elgin (IL-IN-WI) MSA with 406,967 employees; and New York-Newark-Jersey City (NY-NJ-PA) MSA with 338,233 employees.
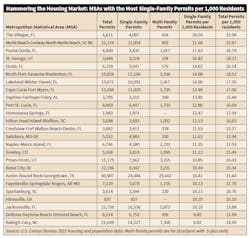
Building Permits
Population Growth
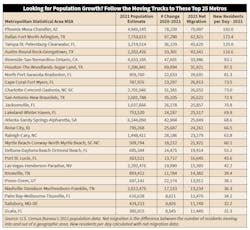
There’s a deep-rooted population shift to Sunbelt metros from many cities in high-tax states like New York, New Jersey, Connecticut, Illinois and other communities in the industrial Midwest. It has shown no sign of slowing down and is continuing to spark surges in home building in Sunbelt MSAs. Cities like Phoenix, Dallas, Austin the Carolinas and most of Florida’s MSAs continue to attract thousands of new residents, while on the flip side, thousands of people from New York, upstate New York and Long Island, Chicago and Cleveland are moving to low tax areas of the Sunbelt with warmer weather. This trend was well underway before COVID-19 hit and has gained momentum in its wake. The chart here 3 ranks metros by new residents per day with the Phoenix and Dallas MSAs leading the pack with 192 residents and 172.4 residents, respectively.
ON A MORE LOCAL LEVEL
Now that you know where to find the data you can use to measure your market, let’s take a look at the characteristics of different types of local markets.
The big dogs
Metros with more than 2 million residents expected to add population the fastest over the next few years. Phoenix, Dallas, Houston, Austin and Tampa-St. Petersburg continue to add new residents
Growth belts— Economically supercharged regions of the U.S.
Raleigh-Durham, Austin-San Antonio and Colorado’s Front Range (Colorado Springs north through Denver and Boulder to Fort Collins, and out to Greeley) are examples of regions that have multiple MSAs with consistently strong growth.
Tech is tops
While commercial construction has slowed in these markets, in “normal” economic conditions, you can usually count on tech hubs like Silicon Valley-San Francisco, San Diego’s biotech patch, Boston, Austin and Seattle to outpace other metropolitan areas.
Stars of the Sunbelt
Big-time population growth continues to drive residential and commercial markets in multiple MSAs in Florida, South Carolina, North Carolina and Texas, Phoenix, Las Vegas and much of Colorado’s Front Range.
Swinging high and low
Cyclical metros that can be really hot or scary bad. Examples of these markets include Dallas, Houston, Orlando and Phoenix. These markets currently are solid.
Vacation land, lifestyle, retirement havens & nirvana for telecommuters and work-at-home enthusiasts
Areas such as Southwest Florida, Bozeman, MT; Bend, OR; Boise, ID; and Myrtle Beach, SC; bank on the leisurely lifestyles they can offer to attract new residents and businesses. Southwest Florida has seen a surge of new residents over past decade and 2020 to 2021 was no different. In the Sunshine State, Tampa-St. Petersburg-Clearwater, FL (125 new residents a day in 2021); North Port-Sarasota-Bradenton MSA (81 new residents a day); and Cape Coral-Fort Myers, FL MSA (74 new daily residents) led the pack.
Small but mighty

Summary
You can use the tools described in this article to analyze the growth potential of a local market and compare it to other markets in your state or at the national level. In EW’s September/October issue, the magazine’s editors will make our picks for the local market areas with the most growth potential in 2023.
About the Author

Jim Lucy
Editor-in-Chief
Over the past 40-plus years, hundreds of Jim’s articles have been published in Electrical Wholesaling and Electrical Marketing newsletter on topics such as the impact of amazonsupply.com and other new competitors on the electrical market’s channels of distribution, energy-efficient lighting and renewables, and local market economics. In addition to his published work, Jim regularly gives presentations on these topics to C-suite executives, industry groups and investment analysts.
He recently launched a new subscription-based data product for Electrical Marketing that offers electrical sales potential estimates and related market data for more than 300 metropolitan areas, and in 1999 he published his first book, “The Electrical Marketer’s Survival Guide” for electrical industry executives looking for an overview of key market trends.
While managing Electrical Wholesaling’s editorial operations, Jim and the publication’s staff won several Jesse H. Neal awards for editorial excellence, the highest honor in the business press, and numerous national and regional awards from the American Society of Business Press Editors. He has a master’s degree in Communications and a bachelor’s degree in Journalism from Glassboro State College, Glassboro, N.J. (now Rowan University).