Market Mix
The end uses for electrical products tend to fluctuate more than the types of customers that buy from electrical distributors, so a sales breakdown from this perspective can show where the action may await in the market.
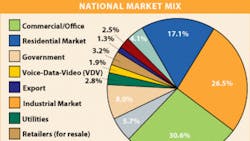
The “Market Mix” table shows distributors' “best guess” on the end-uses for the goods they sell. Distributors who respond to Electrical Wholesaling's surveys know the customers they sell to, but answering questions about what that contractor or industrial did with the material requires distributors to make some assumptions.
Note that the assumptions distributors make about the end-use markets of the products they sell come with a margin of error. Note, too, that the percentages assigned to individual regional markets should be used with some caution because of the Market Planning Guide survey's regional response rates. The national Market Mix data is based upon 176 responses to a 2009 survey for that year's Market Planning Guide, but with the exception of the East North Central, Pacific and Multi-Region segments, the results published for the various regions are based on less than 20 responses and are subject to a wider margin of error.
At a national level, it's interesting to note that the construction and industrial markets account for more than three-quarters of the products that distributors sell. Residential construction and renovation; office/commercial construction and renovation; and industrial business account for 76.2 percent of sales for the average full-line electrical distributor. With this data, you can estimate the uses of product.
With all the noise about the housing market's implosion, it's interesting to note that this industry segment only accounts for 17.1 percent of distributor sales. That's either a little or a lot depending on your perspective, but it's important to know that because it accounts for less than one-fifth of industry sales, the impact of the current housing downturn on the electrical business is somewhat muted.
The “sweet spot” for the electrical wholesaling industry is and has always been the commercial/industrial market, and the pie chart on page 34 clearly illustrates that fact. Accounting for a combined total of 57.1 percent of all products sold by electrical distributors — 62.8 percent if you add in business with original equipment manufacturers (OEMs) for electrical products manufactured into finished goods — the commercial and industrial markets are clearly the most important business segments for electrical distributors, electrical manufacturers and independent manufacturers' reps.
If you are focused on this market, monitor the monthly market indicators that offer a quick read on the health of these segments. These indicators include but are not limited to the U.S. Census Department's New Construction Put-In-Place; electrical contractor employment; electrician employment; industrial capacity utilization; and the Purchasing Managers Index. Electrical Wholesaling publishes data for these statistical areas each month in its ElectroStats department; housing data is available there, too.
If you need more detailed analysis of these markets, you may want to consider purchasing a subscription for construction data sold by McGraw-Hill Construction or Reed Construction. EW's “National Factbook,” published annually each December is another resource for construction data and forecasts. Electrical Marketing newsletter, Electrical Wholesaling's sister publication, also provides more detailed statistical data. Subscription information is available at www.electrical marketing.com.
It looks like the industrial market segment will be strongest in 2012, so you may want to adjust your market mix calculations accordingly.
(please hover mouse over image for larger view, click on image to open in a new window)
