2015 Market Planning Guide
The 6.2% growth for sales through electrical distributors Electrical Wholesaling’s readers are forecasting for 2015 is right in the middle of the electrical wholesaling industry’s historical growth range of 4% to 8%. On one hand, perhaps that growth is pretty good considering how the U.S. economy is reacting to signs of economic contraction in Europe, the Ebola scare, concerns over Russian involvement in the Ukraine, ISIS and the skittish stock market.
But when you look at what’s happening with some drivers that have major impact on the core markets that electrical distributors serve, the number, which came from a survey of over 5,000 electrical distributors on their company’s growth prospects for 2015, may seem a little soft by a point or two. EW’s editors think business in the electrical market should be at least 6% better overall in 2015 than 2014, and potentially much better for companies located in the right geographic areas and serving the right mix of markets.
Unless we get hit by some unforeseen global security crisis or economic calamity, on a national basis 2015 should be a good year for electrical distributors.
Markets that matter. While it’s interesting to cull through the national economic data, most of you probably want to learn more about the key drivers that will support the electrical market’s future growth and the areas of the United States in which it’s happening, so let’s get right to them. Everyone knows about the energy market, but some folks may not be as familiar with the explosion in multi-family housing, the uptick in office construction and the growth of retirement and resort areas. Let’s first look at a brief update on what’s happening in the energy market and then move onto the other key market drivers.
Outside of big MSAs like Houston, New Orleans and Oklahoma City, the markets seeing the most direct impact from the new oil business tend to be in rural areas with total populations of less than 1 million people. When you look at the MSAs nationwide with the highest percent of population growth 2012-2013, energy-oriented MSAs that rank amongst the nation’s Top 20 in percentage of population growth from 2012 to 2013 are: Odessa and Midland, Texas; Bismarck and Fargo, N.D.; and Greeley, Colo. And when you look at the list of small markets with huge housing growth, Fargo, Bismarck, Grand Forks, N.D; and Greeley, Colo.; are on it.
You also see several of these markets pop up on the Top 10 list of the MSAs that have enjoyed the largest percent increase in their “All Industries” Gross Metropolitan Product (GMP), as tallied by the U.S. Bureau of Economic Analysis (BEA). Midland, Odessa, Bismarck, Greeley and Fargo are on this list, as are Williamsport, Pa., which sits in the middle of the Marcellus Shale Region, and Billings, Mont., which borders the Bakken region.
More and more multi-family housing. It doesn’t seem all that long ago that when you looked at the data for multi-family housing starts what stuck out the most was how much it varied from month to month. There always seemed to be wild swings in the numbers, and because so much of the focus before the recession was on the explosive growth of the single-family housing market, it was easy to overlook multi-family housing starts.
That’s clearly not the case anymore. Multi-family housing starts are driving much of the housing market’s growth since the recession because of some far-reaching demographic and cultural changes that may tamp down single-family growth for some time to come. As mentioned earlier, multi-family housing starts are up more than 30% than their pre-recession levels. Much of that growth can be traced to the fact that many new home buyers either can’t afford the usually more expensive down payment on a single-family home or don’t want to deal with the additional maintenance and prefer an apartment or condo downtown.

Office construction is finally recovering. It takes a while for office construction to come around after a recession because it’s so dependent on the hiring patterns of tenants. New office construction seemed to take longer than usual to recover from this recession, with many major metropolitan areas suffering with office vacancy rates of over 20%. Thanks in large part to a dramatic increase in the hiring of tech companies in several key office markets, office construction is on the mend in some areas. CBRE Research says the exceptionally low sub-10% vacancy rates in markets like Boston, New York San Francisco and San Jose, Calif., are due in large part to the construction of new office towers needed because of the increase in tech hiring in recent years.
Resort and retirement areas are growing fast. Popping up among the growth leaders in population and multi-family housing for MSAs with less than 1 million residents are some of the coastal retirement communities in Florida and the Carolinas. Big metros like Atlanta, Houston, Dallas and New York, Los Angeles and Phoenix all added more than 50,000 new residents from 2012-2013. But when you look at the Census data by percent increase in total population you start to see many popular resort/retirement areas, most with less than 500,000 residents in total. Resort/retirement areas that added over 4,000 resident from 2012-2013 include Wilmington and Asheville, N.C.; Hilton Head, S.C.; and Naples and Port St. Lucie, Fla.
HOW TO USE THE MARKET PLANNING GUIDE
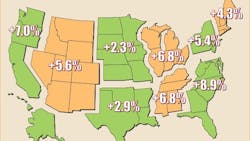
The market planning data in this issue is divided into nine regions of the United States. For each region and state, you’ll find sales forecasts for this year and next year, along with the three prior years’ sales. In addition to the sales forecasts prepared by Electrical Wholesaling’s research department, you’ll also find an economic snapshot of the region and employment statistics for four of electrical wholesalers’ major customer groups: electrical contractors, the commercial market, the industrial market and government.
Methodology. Our forecasts are based upon responses to Electrical Wholesaling’s annual Market Planning Guide (MPG) survey. Each year, the magazine asks electrical distributors for their previous year’s final sales results, sales predictions for the current year, and predictions for the following year. It also asks respondents how sales for the first six months of the current year compared with the first six months of the previous year. This year, EW mailed 5,265 surveys (both by mail and via e-mail) and received 256 usable responses for a 4.9% response rate.
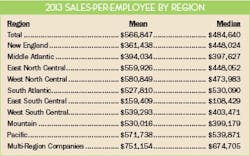
Respondents reported an average sales-per-employee number of $566,847 for 2013, up from the $533,712 respondents reported last year for 2012 but quite a bit lower than the $668,515 average sales-per-employee for EW Top 200 survey respondents. Regional sales-per-employee numbers are provided here. Be sure to check how your company’s productivity compares with the national and regional averages when it comes to sales-per-employee.
Employment data. The employment numbers help develop forecasts for customer buying potential. Compiled from publicly available data at www.bls.gov, the website for the federal government’s Bureau of Labor Statistics (BLS), the Regional Factbook data published in this issue is just a small sampling of what what’s available from BLS. If you want to drill down into more specific types of customers, search for the Current Employment Statistics (CES); if you want to dig into specific types of jobs look for the Occupational Employment Statistics (OES).
EW’s Customer, Market and Product Mixes. The Customer Mix and Product Mix data are available here, or under “Data and Training” in the toolbar by clicking on “Market Planning Guide.” Updated Market Mix data is available in this issue. The Product Mix data offers insight into the product areas that have the most mind share with electrical distributors. Over the years, some product categories have been consolidated or eliminated because their contributions to electrical distributor sales were consistently less than one percent. At www.ewweb.com you will also find expanded capsule summaries for each of the main regions as well as a ton of other local market data.
When developing any market forecast, gathering some basic data on the size and makeup of the market is the first step. Let’s take a look at some of the ways you can crunch the numbers we’ve provided to tailor them to your specific business and market.
Sales estimates. One of the most common uses of this resource is for developing a business plan, whether it be for internal use as your guide for next year or for a presentation to an investor or banker. You will need something that states the size of the local market, and these sales figures are a documented source you can use “as is.”
This data will also be helpful in establishing a sales forecast for your company and your region, comparing nearby or far-flung markets with an eye to opening or closing a branch, and evaluating promising areas of new business.
Employment in major customer markets. In addition to sales forecasts, employment numbers make up a large part of the regional profiles. The number of people employed by a company or in an industry tends to rise and fall with the volume of business it’s doing. Employment figures, therefore, act as a gauge to business prospects and conditions in end-user markets.
- Employee counts can help you compare the relative sizes of various end-user groups in your area.
- You can also compare the make-up of one market area to another, and consider new customer markets or ones that you could be serving better.
- If you track the employment figures for each market over time, you’ll see broad economic trends unfolding.
- You can also use these employment figures to make your own multipliers or you can use the national multipliers we’ve already calculated.
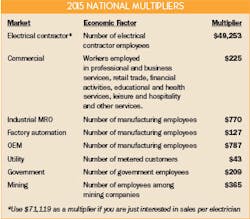
Multipliers. Each multiplier is a dollar figure that represents the average amount of electrical products distributors sell to each particular type of customer, on a per-employee basis or other “economic factor.” (See EW’s National Multipliers). When used with the employment figures in the regional profiles, the multipliers help establish the amount of business electrical distributors could do with major customer groups in your area, and in total.
These multipliers are also a good option for determining sales in an area of the country not covered in the list of metropolitan areas in the regional profiles, but you may have to obtain employment figures or economic factors from local sources. For instance, to find the number of electrical contractor employees in Addison, Ill., a city not detailed in the East North Central regional profile, you could contact the local Chamber of Commerce, the state’s department of commerce or the local library.
These multipliers come in handy if you want to estimate the amount of sales available from a particular account. For example, if a local manufacturer employs 300 people, by applying the multiplier of $770, you would expect the facility to purchase about $231,000 worth of electrical MRO products this year.
Using multipliers results in a dollar figure for market size that tells the level of business electrical wholesalers in the area could do if every potential customer there bought a typical amount of product from them. It tends to be a larger number than actual distributor sales. You can also use EW’s multipliers to track sales through different types of customers over time. Let’s do that for sales through electrical contractors. At the peak of the current business cycle in Oct. 2007, electrical contractors had 943,700 employees, nationally. Using EW’s very conservative multiplier of $49,253 in sales for each electrical contractor employee, that’s roughly $42 billion (in today’s dollars) at the market peak. With the drop in employment at electrical contractors to 783,600 as of August 2014, potential sales are down about 17% from that marke to an estimated $38.6 billion.
Summary. 2015 looks like another good year of overall growth for the electrical market and some great growth for regions of the country and market sectors mentioned above.
About the Author
Jim Lucy
Editor-in-Chief of Electrical Wholesaling and Electrical Marketing
Jim Lucy has been wandering through the electrical market for more than 40 years, most of the time as an editor for Electrical Wholesaling and Electrical Marketing newsletter, and as a contributing writer for EC&M magazine During that time he and the editorial team for the publications have won numerous national awards for their coverage of the electrical business. He showed an early interest in electricity, when as a youth he had an idea for a hot dog cooker. Unfortunately, the first crude prototype malfunctioned and the arc nearly blew him out of his parents' basement.
Before becoming an editor for Electrical Wholesaling and Electrical Marketing, he earned a BA degree in journalism and a MA in communications from Glassboro State College, Glassboro, NJ., which is formerly best known as the site of the 1967 summit meeting between President Lyndon Johnson and Russian Premier Aleksei Nikolayevich Kosygin, and now best known as the New Jersey state college that changed its name in 1992 to Rowan University because of a generous $100 million donation by N.J. zillionaire industrialist Henry Rowan. Jim is a Brooklyn-born Jersey Guy happily transplanted with his wife and three sons in the fertile plains of Kansas for the past 30 years.
Doug Chandler
Senior Staff Writer
Doug has been reporting and writing on the electrical industry for Electrical Wholesaling and Electrical Marketing since 1992 and still finds the industry’s evolution and the characters who inhabit its companies endlessly fascinating. That was true even before e-commerce, LED lighting and distributed generation began to disrupt so many of the electrical industry’s traditional practices.
Doug earned a BA in English Literature from the University of Kansas after spending a few years in KU’s William Allen White School of Journalism, then deciding he absolutely did not want to be a journalist. In the company of his wife, two kids, two dogs and two cats, he spends a lot of time in the garden and the kitchen – growing food, cooking, brewing beer – and helping to run the family coffee shop.