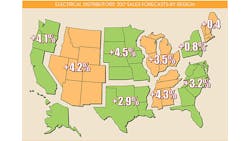
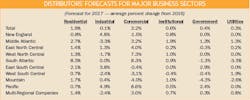
Electrical distributors in various regions of the country had different opinions on their economic prospects, with respondents in the West North Central, Mountain and Pacific regions expecting growth of more than the national average and distributors in the Northeast more pessimistic, with New England distributors calling for marginal growth of 0.4% and distributors in the Middle Atlantic region expecting growth of 0.8%.
Reasons to be cheerful. Don’t despair. Some economists see better growth ahead for the short term, based in part on some encouraging demographic data that may push single-family construction into double-digit growth territory in 2017 and 2018; increased federal spending on public infrastructure; and a comeback of the institutional market and in particular the educational market, which has been lagging office and multi-family construction in the current construction cycle.
The National Association of Home Builders (NAHB), Washington, D.C., sees single-family construction increasing 12.3% and 14.9% in 2017 and 2018, respectively. It also expects the slowdown in multi-family construction, which began this year on a national basis, to continue over the next two years, dropping -0.7% in 2017 and -4.2% in 2018. Two economists at the recent 2017 Dodge Outlook Conference in Washington, D.C. said a key driver for the residential surge will be the increase in the number of Millennials broaching 30 years of age, traditionally a key time for the younger generation to buy their first houses.
Cristian deRitis, senior director, Moody’s Analytics, told conference attendees the demographic trends and pent-up demand for housing because of supply constraints should push single-family housing well past its current annual rate of 800,000 to over one million starts per year, a level the market hasn’t seen since before the Great Recession. He’s definitely bullish on the overall direction of the economy and does not see any severe downturns ahead. “Expansions don’t die of old age. They die because of some jolt or imbalance in the economy,” he said at the Dodge Outlook Conference.
Bob Murray, chief economist and vice president for Dodge Data & Analytics, believes single-family construction has room to grow over the next few years, in part because of historically low mortgage rates and because a loosening in mortgage qualification standards will help fuel the surge in single-family construction. Both Murray and deRitis sad the one wild card in the single-family growth scenario is the question of whether Millennials will migrate to single-family homes, or if they will prefer apartment/condo living in more urban environments. Murray reminded conference attendees that the health of residential construction is an important indicator, because in the construction cycle you first have residential construction growth, followed by commercial construction and then institutional projects.
On the institutional front, Murray says demographic trends, delayed maintenance on existing schools and the passing of more school bond issues will push educational construction. He pegs overall growth for Dodge’s Institutional construction category at 10% in 2017; educational construction at +10% and healthcare construction at +7%.
Distributors speak out on market share and capital investments. EW’s editors found it interesting that of the 162 respondents expecting sales growth next year, about 57% said they would get that growth primarily from overall growth in the market and 43% said they would grow by taking market share from competitors.
Going into 2017, distributor aren’t too bullish on capital investments. Approximately 71% of respondents said they didn’t have major investments planned for next year. For those companies that do plan to make significant investments, the most popular equipment was as follows: delivery trucks (68.2%); material handling equipment (45.5%); smartphones (34.8%); tablet computers (30.3%); and ERP systems (10.6%).
This hesitancy on the investment front also seemed to carry through on respondents’ hiring plans for 2017. Only 26.9% of respondents said they plan to hire new employees next year, and 36.1% said they would be hiring new employees only when jobs open up. Thirty-five percent of the distributors said they do not anticipate hiring any new employees next year. Less than 2% of respondents said staff reductions seem likely next year.
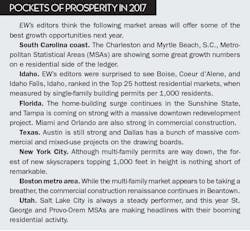
As in any year, markets will do much better (or worse) than others, and the factoid on page 20 showcases our picks for the areas with the best growth potential. Some niches within your product mix would seem to offer better opportunities than other areas, too.
Lead with lighting. When you look at your product mix for growth areas, it’s hard not to look first at LED lighting. Top 200 distributors told EW in a recent survey that LEDs now account for half of all their lamps sales. That in itself is a remarkable statistic and shows just how fast LEDs are transforming the lighting market. While using LED retrofits to drive new sales opportunities isn’t a new idea, there’s no doubt the lighting market is craving well-informed solution providers in local markets who can help electrical contractors, building owners and other buying influences retrofit existing lighting systems with LED solutions.
Help customers do their jobs faster, smarter, safer and more profitably. In a slow-growth environment, your customers want to squeeze every nickel of profitability out of every job. Sometimes that means stocking hand tools and power tools that help them install electrical products more efficiently on job-sites. Other times it’s alerting customers to new prefab electrical products or systems. And sometimes it may even mean helping them run their business better, by mentoring them on bookkeeping, marketing, operations and business skills that you may have and they lack.
Let’s take a look now at how to position your company to take advantage of these and other sales opportunities while adapting to 2017’s economic climate.
HOW TO USE THE MARKET PLANNING GUIDE
The market planning data in this issue is divided into nine regions of the United States. For each region, you’ll find sales forecasts for this year and next year, along with the three prior years’ sales. We no longer provide sales forecasts for individual states because of concerns about the accuracy of the data at that more local level. In addition to the sales forecasts, prepared by EW’s research department, you’ll also find an economic snapshot of the region and employment statistics for the typical distributors’ two largest customer groups — electrical contractors and manufacturing employees.
Methodology. Our forecasts are based upon responses to EW’s annual Market Planning Guide (MPG) survey. Each year, the magazine asks electrical distributors for their previous year’s final sales results, sales predictions for the current year, and predictions for the following year. It also asks respondents how sales for the first six months of the current year compared with the first six months of the previous year.
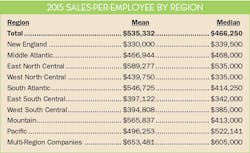
We mailed 6,142 (both by mail and via e-mail) and received 245 usable responses for a 5.3% response rate. Respondents reported a mean sales-per-employee number of $535,332 for 2015, down substantially from $647,595 in 2014.
Regional sales-per-employee numbers are provided on page 18. Be sure to check how your company’s productivity compares with the national and regional averages when it comes to sales-per-employee.
A note on our national sales base number. The base sales number for our national sales forecast comes from the Census of Wholesale Trade that the Commerce Department sends out every five years. Data from the most recent survey in 2012 was finally available last year for the category that most closely defines our electrical market —“NAICS: 423610 - Electrical apparatus and equipment, wiring supplies, and related equipment merchant wholesalers” (specifically “Merchant wholesalers, except manufacturers’ sales branches and offices”).
The U.S. Commerce Dept. has a very broad definition of an electrical distributor, and its most recent data shows 13,789 branch locations run by electrical distributors — more than double what EW’s editors have been able to verify for what most industry execs would consider to be distributors of electrical supplies. With such a huge branch count, the Census Dept. estimate for total industry sales isn’t realistic either, and we worked with Herm Isenstein, president, DISC Corp., Orange, Conn., the electrical market’s leading economist, to develop a base sales estimate for 2012 of $86.5 billion. EW’s sales estimates for 2012 to 2016 and for the next five years (until the next Census of Wholesale Survey trade will be published again in 2020) will use this base national sales number for 2012.
EW’s editors will “bring forward” that number for an annual national sales forecast each year using the same survey methodology that Andrea Herbert, EW’s late chief editor, first developed in the 1970s for the Market Planning Guide.
Employment data. The employment numbers in the Regional Factbook can help you develop forecasts for customer buying potential. Compiled from publicly available data at www.bls.gov, the website for the federal government’s Bureau of Labor Statistics (BLS), the Regional Factbook data published in this issue is just a small sampling of what what’s available from BLS. If you want to drill down into more specific types of customers, search for the Current Employment Statistics (CES); if you want to dig into specific types of jobs look for the Occupational Employment Statistics (OES).
EW’s Customer, Market and Product Mixes. As in the past few years, this data is only available online at www.ewweb.com. Just go to the website and click on “Data and Training” and then “Market Planning Guide.” The Customer Mix and Market Mix are great resources if you’re looking for sales breakdowns of full-line distributors’ key customer and market segments. The Product Mix data offers valuable insight into the product areas that have the most mind share.
DEVELOPING SALES ESTIMATES
When developing any market forecast, gathering some basic data on the size and makeup of the market is the first step. Let’s take a look at some of the ways you can crunch the numbers we’ve provided to tailor them to your business.
One of the most common uses of this resource is for developing a business plan, whether it be for internal use as your guide for next year or for a presentation to an investor or banker. You will need something that states the size of the local market, and these sales figures are a documented source you can use “as is.”
This data will also be helpful in establishing a sales forecast for your company and your region, comparing nearby or far-flung markets with an eye to opening or closing a branch, and evaluating promising areas of new business. One question distributors should ask themselves — and suppliers will be asking — is: “Are our sales into the market at the level they should be?” Look at the estimate of the overall sales in your market in comparison with your company’s sales.
Employment in major customer markets. In addition to sales forecasts, employment numbers make up a large part of the regional profiles. The number of people employed by a company or in an industry tends to rise and fall with the volume of business it’s doing. Employment figures, therefore, act as a gauge to business prospects and conditions in end-user markets.
- Employee counts can help you compare the relative sizes of various end-user groups in your area.
- You can also compare the make-up of one market area to another, and consider new customer markets or ones that you could be serving better.
- If you track the employment figures for each market over time, you’ll see broad economic trends unfolding in your market.
- You can also use these employment figures to make your own multipliers or you can use the national multipliers we’ve already calculated.
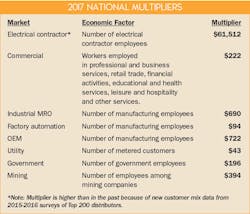
Multipliers. Each multiplier is a dollar figure that represents the average amount of electrical products distributors sell to each particular type of customer, on a per-employee basis or other “economic factor.” (See EW’s National Multipliers on page 17). When used with the employment figures in the regional profiles, the multipliers help establish the amount of business electrical distributors could do with major customer groups in your area, and in total.
For instance, to find the number of electrical contractor employees in Addison, Ill., a city not detailed in the East North Central regional profile, you could contact the local Chamber of Commerce, a nearby union chapter, the state university, or the local library to track it down.
These multipliers come in handy if you want to approximate the amount of sales available from a particular account. For example, if a local manufacturer employs 300 people, by applying the multiplier of $690, you would expect the facility to purchase about $207,000 worth of electrical MRO products this year.
Using multipliers results in a dollar figure for market size that tells the level of business distributors in the area could do if every potential customer there bought a typical amount of product from them. It tends to be a larger number than actual distributor sales.
You can also use EW’s multipliers to track sales through different types of customers over time. Let’s do that for total U.S. sales to electrical contractors. Using EW’s national multiplier of $61,512 in sales for each electrical contractor employee and contractor employment through August of 884,000, that’s roughly $54.4 billion in sales.
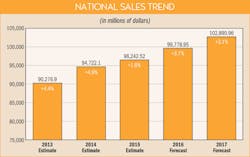
Summary. If some of the macroeconomic trends discussed earlier kick in and some of the economic uncertainty lifts once the election is over, we may be looking at a market that does better than the 3.1% EW’s readers forecast for 2017. Your best bet may be to prepare for slow growth but be ready to invest in your business if things start looking up.
About the Author
Jim Lucy
Editor-in-Chief of Electrical Wholesaling and Electrical Marketing
Jim Lucy has been wandering through the electrical market for more than 40 years, most of the time as an editor for Electrical Wholesaling and Electrical Marketing newsletter, and as a contributing writer for EC&M magazine During that time he and the editorial team for the publications have won numerous national awards for their coverage of the electrical business. He showed an early interest in electricity, when as a youth he had an idea for a hot dog cooker. Unfortunately, the first crude prototype malfunctioned and the arc nearly blew him out of his parents' basement.
Before becoming an editor for Electrical Wholesaling and Electrical Marketing, he earned a BA degree in journalism and a MA in communications from Glassboro State College, Glassboro, NJ., which is formerly best known as the site of the 1967 summit meeting between President Lyndon Johnson and Russian Premier Aleksei Nikolayevich Kosygin, and now best known as the New Jersey state college that changed its name in 1992 to Rowan University because of a generous $100 million donation by N.J. zillionaire industrialist Henry Rowan. Jim is a Brooklyn-born Jersey Guy happily transplanted with his wife and three sons in the fertile plains of Kansas for the past 30 years.
