If you haven’t already started your market planning for 2018, you probably will be getting that call from your boss very soon. Published each November for more than three decades, Electrical Wholesaling’s Market Planning Guide has lots of fans. One of the few gripes we occasionally get about it from readers is that they wish it came out sooner so they can utilize it during the third quarter of each year, when many companies start their market planning.
While this article won’t provide 2018 sales projections like the Market Planning Guide, it will offer some insight into the markets that appear to have the most momentum going into next year and offer some ideas on where to find information now that you can use to build your strategic marketing plan for next year.
WHERE TO FIND THE DATA
U.S. government data. If you are a do-it-yourselfer and have the time and want to find the data yourself familiarize yourself with three key websites — the U.S. Bureau of Labor Statistics (www.bls.gov); the U.S. Department of Census (www.census.gov); and the U.S. Bureau of Economic Analysis (www.bea.gov). You can find monthly local market and national indicators for employment, building permits, population, Gross Metropolitan Product (GMP) and value of new construction.
Trade associations and company forecasts. There’s quite a bit of monthly economic data from several key associations and companies. Here are our six favorite stops on the economic data highway:
- Purchasing Managers Index – Institute for Supply Management (www.instituteforsupplymanagement.org)
- Architecture Billings Index and annual Consensus Construction Forecast – American Institute of Architects (www.aia.org)
- Oil rig counts – Baker Hughes Rig Count (http://bit.ly/1elov2d)
- Local housing starts and building permits – National Association of Home Builders (www.nahb.org)
- U.S. Leading Economic Indicators Index – Conference Board (www.conference-board.org)
- Construction activity – Dodge Data & Analytics (www.construction.com
Electrical Wholesaling. The magazine’s monthly Electrostats department offers a quick read of more than 20 national indicators; the Market Planning Guide in November can’t be beat; and Herm Isenstein’s outlook articles, usually published twice each year; will get you started. And, of course, www.ewweb.com offers access to much of the magazine’s data content in a fresh, newly designed website.
DISC Corp. If you don’t have the time to search for all of this data and have a little money in your budget, you may want to consider contacting Herm Isenstein, president of DISC Corp., Orange, CT (www.disccorp.com) about purchasing some of his forecast data. No one takes a deeper dive into the local market data than Herm, and for more than 30 years the company has provided generations of electrical executives with reasonably priced sales forecasts on the national, state and local level.
Electrical Marketing newsletter. In the shameless self-promotion department, we would like to suggest Electrical Marketing newsletter, EW’s sister publication that’s now available at a special introductory rate of $395 per year. It will be offering an expanded digital data offering for industry executives who need 24/7 access to electrical market data. Over the past year, Electrical Marketing’s editors have been gradually building out their data and by Sept. 15, www.electricalmarketing.com will be aggregating key electrical market indicators and other market data for subscribers. Electrical Marketing will also be offering subscribers a new series of quarterly Electrical Market Updates – quarterly webcasts where attendees will get a 45-minute analysis of key economic market trends and insight into the hottest local markets.
THE BIG PICTURE
Now that you have a feel for the type of data that’s available, let’s look at some data for several key publicly available electrical market indicators — electrical contractor employment, manufacturing employment, population growth, gross metropolitan product (GMP) and building permits. They will give us a rough idea about where the electrical market may be headed in 2018 in the fastest-growing local markets. The tables in this article list the metropolitan statistical areas (MSAs) showing the biggest increases for each of the indicators discussed in this article. If you need this data for all 300-plus metropolitan statistical areas (MSAs), it will be available at www.electricalmarketing.com as part of the special $395 subscription price.
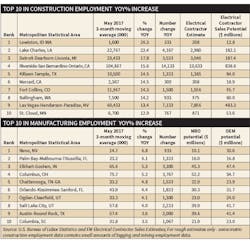
Electrical contractor employment. Historically speaking, whenever national electrical contractor employment stays above the 800,000 level, times are pretty good. According to data from the U.S. Bureau of Labor Statistics, the three-month moving average for May 2017 stood at 872,433 employees, which is pretty darn good. The only warning sign is that the rate of change in the 12-month moving average has slowed over the past year. The good news is that after a few hiccups in 1Q 2017 the shorter-term three month moving average has been more or less steadily increasing, a good sign for the future. Electrical Wholesaling spends a lot of time watching trends in electrical contractor employment because contractors account for close to 50% of all sales through full-line electrical distributors and each employee represents $61,512 in sales potential. While BLS doesn’t offer local data on electrical contractor employment at the MSA level, EW’s editors found that it’s historically 13% of total construction employment. The chart on page 18 offers some insight into the MSAs enjoying the biggest surges in construction employment over the past year. In terms of year-over-year (YOY) growth through May, the Lewiston, ID-WA MSA topped the list with a whopping 26.3% increase. The Riverside-San Bernardino-Ontario, CA MSA saw a giant increase in construction employment, too, with 14,133 new workers in this field – and an estimated 13,633 electrical contractor employees.
Manufacturing employment. No MSAs are seeing the sort of double-digit increases in manufacturing employment that the fastest-growing MSAs in construction employment are enjoying. The Reno, NV MSA, home to Tesla’s gigafactory, topped the industrial employment list in terms of percent growth YOY through May with a 6.8% increase and 933 new manufacturing employees. Some MSAs seeing nice increases in manufacturing employment through May include Columbus, OH (+3,767); Elkhart, IN (+3,300); Salt Lake City, UT (+2,233); and Austin-Round Rock, TX (+2,000). As fans of Electrical Wholesaling’s Market Planning Guide’s national multipliers know, each manufacturing employee represents $690 in potential for industrial MRO business, $722 in OEM business and $94 in factory automation business. See chart on page 18 for the Top 10 markets with the biggest percent increases in manufacturing employment.
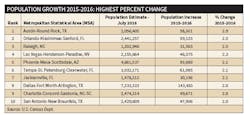
Population growth. As you look over local economic data it quickly becomes apparent that the MSAs attracting the most new residents are almost always some of the metros seeing the most growth in construction employment, building permits and other economic activity. The U.S. Census Bureau offers some insight into the fastest-growing metros on both a year-over-year basis, as well as from 2010 to 2016. The chart below shows the Top 10 in percent change populations growth from 2015 to 2016.
The Austin-Round Rock MSA is among the leaders in most of the local economic indicators we track and it’s #1 in population change from 2015 to 2016 with 58,301 new residents. With a 19.8% increase and 340,085 new residents from 2010 to 2016, it was ranked only behind the Villages MSA in Florida (+32.7% increase). To anyone who watches the Austin economy, it will probably come as no surprise that according to population projections in a recent article in by G. Scott Thomas on www.bizjournals.com, the Austin metro is expected to add more than 300,000 new residents from 2010 to 2015, a 15% increase to a total of 2.3 million residents.
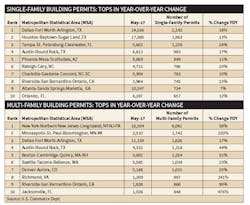
Building permits. This monthly data compiled by the U.S. Census Bureau is considered to be a reliable indicator of residential building activity five to six months in the future, and a leading indicator for retail and light commercial growth as well as home improvement purchases. That’s because when people move into their new homes they need places to shop, eat and gas up their cars, and they will be making plenty of trips to the local home centers to make their new house feel like home.
On a national basis through May, single-family permits are up 11% over May 2016 to 304,400 and multi-family permits are down –1% to 165,645. In the single-family arena, it’s all about the Sunbelt, as the Top 10 markets are all in sunny climates, with three MSAs in Texas, two in North Carolina, two in Florida and the rest scattered in Georgia, California and Arizona. Leading the pack with a combined total of over 4,000 single-family permits are Dallas and Houston. Austin comes in at #3 with 983 permits year-to-date.
Multi-family activity currently has a different profile, with market leaders all over the country and not just in the Sunbelt. Despite a slowdown compared to recent years, in 2017 the Big Apple remains the undisputed leader in multi-family permits pulled for 6,081 multi-family units. Minneapolis and Boston are in the mix, too.
Gross Metropolitan Product (GMP). GMP is the value of all final goods and services produced within a MSA. It’s a good indicator of the overall health of a MSA’s economy. The U.S. Bureau of Economic Analysis (BEA) also offers GMP for many large industry categories. While the GDP for the overall U.S. economy is growing around 2%, the fastest-growing metros enjoy growth rates of twice that or more. The GMP data is for 2014–2015, the most recent available from BEA, but you can find some interesting GMP forecasts in the U.S. Metro Economies Report prepared annually by IHS Markit Global Insight for the U.S. Conferences of Mayors and the Council on Metro Economies and the New American City. As you will see in this report and in the chart on page 13, the highest-ranking MSAs when measured by GMP are many of the “usual suspects” that we saw among the leaders in construction and manufacturing employment, population growth and building permits.
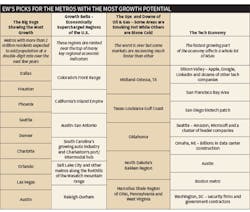
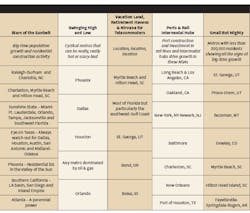
Trends in top-performing markets. As you can see in the chart on pages 16–17, “Our Picks for the Metros with the Most Growth Potential,” many of the MSAs that consistently showed up on the leaderboards for our various local economic indicators had some defining characteristics that set them apart from MSAs with less robust economies. These fastest-growing metros can be grouped into these categories:
- The Big Dogs – Metros with more than 2 million residents expected to add population at a double-digit rate over the next few years
- Growth Belts – Economically supercharged regions of the U.S.
- Oil & Gas – Some metros are smoking hot, while others are stone cold
- The Tech Economy – The fastest-growing part of the economy affects a whole lot of MSAs
- Stars of the Sunbelt – Big-time population growth and residential construction activity
- Swinging High and Low – Cyclical metros that can be really hot or scary-bad
- Vacation Land, Retirement Havens & Nirvana for Telecommuters
- Ports Rails and Intermodal Hubs – Port construction and investment in rail lines and intermodal hubs drive growth in these MSAs
- Small But Mighty – Metros with less than 500,000 residents showing all the signs of big-time growth
Summary. EW’s editors hope you enjoy our picks for the hottest local markets, snapshots of what’s happening with the some key electrical market indicators, and resources you can utilize to get that 2018 strategic market plan started.
About the Author
Jim Lucy
Editor-in-Chief of Electrical Wholesaling and Electrical Marketing
Jim Lucy has been wandering through the electrical market for more than 40 years, most of the time as an editor for Electrical Wholesaling and Electrical Marketing newsletter, and as a contributing writer for EC&M magazine During that time he and the editorial team for the publications have won numerous national awards for their coverage of the electrical business. He showed an early interest in electricity, when as a youth he had an idea for a hot dog cooker. Unfortunately, the first crude prototype malfunctioned and the arc nearly blew him out of his parents' basement.
Before becoming an editor for Electrical Wholesaling and Electrical Marketing, he earned a BA degree in journalism and a MA in communications from Glassboro State College, Glassboro, NJ., which is formerly best known as the site of the 1967 summit meeting between President Lyndon Johnson and Russian Premier Aleksei Nikolayevich Kosygin, and now best known as the New Jersey state college that changed its name in 1992 to Rowan University because of a generous $100 million donation by N.J. zillionaire industrialist Henry Rowan. Jim is a Brooklyn-born Jersey Guy happily transplanted with his wife and three sons in the fertile plains of Kansas for the past 30 years.


