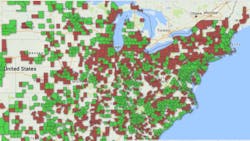
County Population Change 2010-2015
Population growth is a good economic indicator you can use to measure the future economic growth prospects of a local economy. This online tool can help you find out which counties are adding the most new residents.
Just scroll over to and click on the county of interest to check out the population growth from 2010-2015, according to the U.S. Census Bureau. Counties shaded in red lost population from 2010 to 2015 and counties shaded in green added population.
Twenty-five counties added more than 100,000 residents over this five-year period, led by Houston's Harris County at 429,841 new residents; Los Angeles County at 344,283; and Phoenix's Maricopa County at 342,350. Losing the most residents were Detroit's Wayne County at 55,864; Cleveland's Cuyahoga County at -22,305; and Flint, MI's Genessee County at 14,208.
