Looking through the windshield is in general better than looking through the rearview mirror. It hasn’t always been so for the electrical industry, but it is for the coming year.
Looking back, the first quarter of this year was a surprise and a disappointment to DISC, much of it attributed to a bad winter which wreaked havoc in the nation’s heartland and East Coast.
Last January, coming off a weak 2013 Q4,with industry sales increasing a thin 2% we confidently predicted industry sales in 2014 Q1 would advance 6% from the year ago quarter. We accounted for the economic dynamics, but the economic dynamics did not account for the weather.
In the event, actual industry sales undershot our forecast by 3.5 percentage points in Q1.
But our January 2014 forecast over the last three quarters of the year was well within our margin of error, off fractionally in the middle quarters and off about 2 points in Q4. This is compared with our current analysis, with the final two quarters still a forecast.
Bottom line, last January we forecasted 2014 industry sales to advance 6.4% for the year. We are now forecasting 2014 to increase 4.9%. A miss of 1.5 percentage point is still a very good forecast, nonetheless. But, certainly annual growth of less than 5% is not a very good industry performance.
Major Concerns Ahead
As we moved through this year we saw a number of economic events developing that are not as encouraging for the coming year, 2015, compared to what we expected for 2015 from our view in January 2014. Here are the major concerns that will play on our industry.
1. Weak European Union markets
2. A strong dollar
3. Falling oil prices
4. A distributor-served residential market not as robust as we expected from our vantage at the beginning of this year.
The weak markets and strong dollar will hurt our nation’s export industries. Although the domestic electrical industry is not strongly dependent on exports, we do serve many industries that serve the European market arena. And combined with a strong dollar this has a decidedly negative impact on demand for electrical products by the domestic industries we serve, and who in turn market their products and services to the European Union.
Falling oil prices of course can cut both ways. In one sense it affects distributors’ operating expenses. That’s a plus. But here’s the downside. Oil and gas exploration will weaken marginally as energy prices fall. This has been a very good industry that has contributed to the electrical industry growth in recent years.
The most immediate effect will be on distributors, manufacturers and reps directly serving these energy producing companies. But there are additional factors impacting the electrical industry serving satellite industries that serve the oil industry.
On balance, the question is whether the electrical industry is hurt more by reduced demand for its products from falling oil prices than it gains in reduced operating expenses from falling oil prices.
The Dashboard
“Dashboard” increasingly has become a catch word for tracking performance. The Federal Reserve Board’s chairperson, Janet Yellen, recently referenced her “dashboard” of indicators she watches to judge overall economic performance.
The DISC “dashboard” tracks quarterly indicators and these have direct predictive content for the electrical industry. If you watch these indicators, construction spending for residential and nonresidential and business spending for equipment, which are always in our quarterly DISC Report, I am totally confident you will be seeing the most relevant drivers of trends in this industry. But along with the indicators in the DISC Report you will also see our take on industry performance past, present and future.
In addition to the quarterly indicators, our dashboard includes monthly performance of construction put in place and housing starts. That addresses the distributor served contractor market. But we also watch industrial production and new orders for nondefense capital equipment which correlates with the distributor served industrial market. One could concoct a ton of indicators, but for the electrical industry, these are the ones to watch.
Of immediate concern, your monthly dashboard for your business performance undoubtedly includes, among others, order backlogs, margins, etc. And of course, market share is ever present. But I want to emphasize an indicator that often is overlooked which directly hits your bottom line.
Productivity
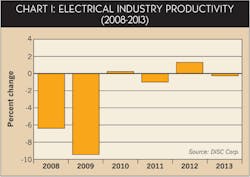
Output per employee is arguably the most crucial indicator for one’s business. And it’s not the simple $/employee ratio. It’s the change in real output per employee that’s the true measure of efficiency. That’s a simple measure you can track every month. Improving productivity will always and directly hit your bottom line.
The numbers in Chart 1 measure total electrical industry sales after inflation (deflated by an industry price index) and divided by total number of employees, then corrected for the percentage change in the ratio. This industry productivity performance is not a pretty sight. Electrical industry productivity since 2008 is underwhelming. But it is a reflection of what the industry collectively has done. What it suggests is that the industry has misjudged market performance by not reacting in a timely way to changes in the economic environment governing this industry.
The question is whether you have managed your business resources better than the industry collectively has managed its resources over the past six years.
The Years Ahead
We see industry growth this year up 4.9% from a relatively weak 3.6% gain in 2013.
Forecasted growth of 4.9% implies real physical volume (after inflation) growth of 3.5%. Will your business grow better than 3.5% this year, after inflation, and has that growth rate exceeded the real resources you have added to your business this year? How does that compare with what you did last year?
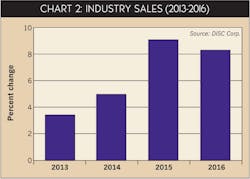
The key segment driver for overall industry sales growth this year is the distributor-served contractor market, up better than 6.5%. Next year we expect total industry sales to top $100 billion, a milestone. Industry growth at 8.9% will be the best since 2011.
Look for the distributor-served industrial market to lead total electrical industry sales growth, at 10%, followed by the distributor served contractor market, which will be up 9% (see Chart 2).
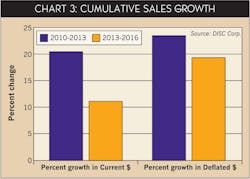
The stark message is that in the 2010-2013 period nearly 10% of revenue gains were a result of inflation. Anyone who tracked overall industry sales and pricing performance and increased their real investment in their business to the tune of 20% (the growth in current dollar revenue), over-invested and likely did not see much of a return on their investment. There goes your bottom line.
On the contrary, we expect a 19.7% cumulative increase in industry revenue, after inflation, between 2013-2016. That is strong real growth and should be taken into account when making resource allocation decisions in the next few years.
Summary
Every forecast has its silver lining and its dark clouds. That spells uncertainty. But at the same time this is our best point forecast for 2015 and for our longer term outlook. Overall, we are optimistic that industry revenues next year and going forward will be stronger than the past three years.
The caveat to keep in mind is to carefully monitor your company’s productivity so your investments will result in stronger company profits.
About the Author
Herm Isenstein
Herm passed away in Sept. 2019 at the age of 86 from brain cancer. He was a good friend to the editors on the staff of Electrical Wholesaling and a prolific writer for the magazine for 15 years.
During his 30-plus years in the electrical industry, Herm Isenstein was the premier economist in the electrical wholesaling industry If you have any questions about DISC's subscription-based data services, contact Chris Sokoll, DISC's president at at 346-339-7528.


