
Emails are probably starting to come in from your supervisors right about now, asking you to develop a 2020 sales forecast. Don’t sweat it. There’s quite a bit of data available if you know where to look. This article will offer some tips on where to go for information that will help you map out a forecast for your company’s local markets.
Now that we are past the half-way mark in 2019, you may be seeing bits and pieces of national forecast data for the first six months of this year, and possibly some 2020 forecast national forecast data for the U.S. electrical market. It’s a bit of a mixed bag, so before we drill down into the most promising local markets for next year, let’s look at where we are at for some of the key national economic indicators. All business is local, and you will spend most of your time analyzing data for the local geographic markets that your company serves. But it’s important to get a sense of how your local markets compares to the trends in national economic indicators.
A NATIONAL VIEW
Construction market. With the electrical contractor-served construction market accounting for anywhere from 45% to more than 50% or more of all sales through electrical distributors, this is the single largest piece of business for many if not most companies in the electrical wholesaling industry. Many of the key indicators that measure the overall construction market point to some market contraction on a year-over-year basis. Through May 2019, the U.S. Census Bureau’s closely watched “Value of New Construction Put-In-Place” data shows total construction is off -2.3% from May 2018 to $1,293.9 billion, largely because of the -11.2% YOY drop in single-family construction, which accounts for 39% of all construction dollars spent. Don’t despair. The National Association of Home Builders (NAHB), Washington, DC, anticipates that in 2020 single-family housing will increase +3.8% to a very healthy 902,000 starts, based in large part on friendly mortgage rates and some pent-up demand.
While the top-line national “Value of New Construction” numbers show some softening over 2018, some construction categories that offer a ton of sales opportunities to the electrical market remain strong. The most recent data through May shows that private office construction, which accounts for 5.2% of the total spend is up +7.3% to $67.7 billion and that public school construction is up +5.7% YOY to $79.3 billion. Robert Murray, chief economist for Dodge Data & Analytics, expects the educational market to be fueled by a more positive climate for the local bond issues that drive much of the local K-12 construction.
Not all of the construction activity indicators are as bullish as some segments of the Value of New Construction data. An important leading construction market indicator to watch is the monthly Architecture Billings Index (ABI) published by the American Institute of Architects (AIA), Washington, DC. The ABI is flashing some warning signals because of drops in design contracts and inquiries at architecture and design firms.
“With billings declining or flat for the last five months, it appears that we are settling in for a period of soft demand for design services,” said AIA Chief Economist Kermit Baker in the most recent report. “With the new design contracts score reaching a 10-month low and the project inquiries score hitting a 10-year low, work in the pipeline may start to get worked off, despite current robust backlogs.”
Electrical contractor employment. Electrical contractor employment is in the midst of a historically strong run at well over the 900,000-employee level that shows no sign of slowing down. Published by the U.S. Bureau of Labor Statistics (www.bls.gov), through May the three-month moving average (used to smooth out monthly variances) in U.S. electrical contractor employment stands at 952,100, up approximately +2% over May 2018. EW’s editors always considered 800,000 to be a healthy employment number for electrical contractors on a national basis, and its been at that level since August 2018 — and hasn’t been below 900,000 since July, 2017. As a point of comparison, as the United States was emerging from the Great Recession, electrical contractor employment was below 800,000 from March 2009 through July 2014.
Fans of EW’s Sales-per-Employee multipliers are familiar with this data, which is updated annually in November’s Market Planning Guide. Local market estimates using the multipliers are part of a $99 Electrical Marketing subscription at www.electricalmarketing.com. It’s updated each month and is available at the county, state and Metropolitan Statistical Area (MSA) level. We estimate that electrical contractors will buy $63.1 billion in electrical supplies through electrical distributors in 2019.
Oil & gas market. Distributors, manufacturers and reps involved with the oil & gas market often track the Baker-Hughes Rig Count (https://rigcount.bhge.com/na-rig-count), a free database on oil & gas activity that’s sorted out by state and basins. Through mid-July, the national numbers have softened a bit over 2018, but that’s largely due to a slowdown in drilling activity in three large oil basins—the Permian Basin in Texas and New Mexico; Texas’ Eagle Ford Basin; and Oklahoma’s Cana Woodford Basin.
Hot projects. On a national basis, the most active project categories over the past year have been data centers, airports, light-rail/commuter rail, mixed-use projects, and mega-billion pharmaceutical and LNG exports plants along the Gulf Coast. Electrical Marketing newsletter’s New Project Database offers details on more than 900 large projects valued at $100 million or more, either underway or in the pipeline. Dodge Data & Analytics (www.construction.com) and ConstructConnect (www.constructconnect.com) are the two largest sources of subscription-based project data and are worth the investment when you need more detailed information on local construction projects of all sizes.
Industrial market. National indicators for this key market segment are mixed, and anecdotal reports from electrical manufacturers that focus on the industrial market reflect their concerns over the current situation with tariffs. One industrial market indicator that gets a lot of ink in the business and financial press is the Purchasing Managers Index (PMI) published monthly by the Institute for Supply Management, Tempe, AZ. This monthly survey of industrial purchasing managers, which reflects their thoughts on the purchasing environment several months in the future, has been sliding in recent months and heading toward contraction territory.
A more positive industrial market indicator is the monthly manufacturing employment data that BLS publishes. The three-month moving average through May of 12.8 million industrial employees is tracking at approximately +2% growth over the past year. This employment data, coupled with Electrical Wholesaling’s sales-per-employee multipliers, helps users build sales potential estimates for the industrial MRO, OEM and factory automation segments. You also get regularly updated employment estimates as part of an Electrical Marketing subscription.
THE LOCAL LEVEL
For most Electrical Wholesaling readers, this is where the rubber meets the road. The national data at the 35,000-foot-level discussed in this article is good for an overview on the overall direction of the market and is an important point of comparison, but local market conditions vary wildly from the national level. We find that much of the growth on the local level can be found in MSAs that fit one of the following profiles.
The big dogs. Metros with more than 2 million residents expected to add population the fastest over the next few years. Houston and Dallas are leading the pack right now.
Growth belts. Economically supercharged regions of the United States. Raleigh-Durham, Austin-San Antonio, San Jose-San Francisco and Colorado’s Front Range (Colorado Springs north through Denver and Boulder to Fort Collins and Greeley) are examples of regions that seem to always be in the fast track.
The oil & gas economies. Midland-Odessa, TX, led the nation by many growth metrics in recent years, but the rig count has slowed down some there and in Oklahoma. Other areas to watch are New Mexico, and North Dakota’s Bakken/Williston Basin. In the gas markets, the three biggest basins are the Marcellus (OH, PA & WV); Haynesville (LA & TX); and Utica (OH & PA).
Tech is tops. Silicon Valley-San Francisco, San Diego’s biotech patch, Boston, Austin and Seattle are still growing fastest.

Stars of the Sunbelt. Big-time population growth continues to drive residential and commercial markets in multiple MSAs in Florida, South Carolina, North Carolina and Texas, Phoenix and much of Colorado’s Front Range.
Swinging high and low. Cyclical metros that can be really hot or scary-bad. Dallas, Houston, Orlando and Phoenix are super-busy right now, but they can hit the skids in tough times.
Vacation land, lifestyle, retirement havens & nirvana for telecommuters. Bozeman, MT; Bend, OR; Boise, ID; St. George, UT; Myrtle Beach, SC; and Southwest Florida bank on the leisurely lifestyles they can offer to attract new residents and businesses.
Ports, freight rail lines and intermodal hubs. Port construction and investment in rail lines and intermodal hubs drive growth in these MSAs. All of the larger ports, including Long Beach-Los Angeles, Houston, Oakland and New York-New Jersey have benefited from this trend. Activity in some smaller ports, like Savannah GA, also is strong.
Small but mighty. Metros with less than 500,000 residents showing all the signs of big-time growth. See vacation/retirement/lifestyle metros.
METRICS THAT MATTER
The overview of national electrical market indicators presented earlier offers a quick snapshot of the economic health of the electrical wholesaling industry. That’s an important perspective to have when analyzing local markets because you can compare how a county, MSA or state is doing compared to the national growth averages for the same metrics.
But most EW readers will spend their time analyzing the data for local markets of interest, looking at things like the change year-over-year (YOY) in electrical sales potential; the number of people employed by electrical contractors or industrial companies in the local markets; and trends in residential housing construction and population growth. The U.S. government provides free monthly data for several key measures that will prove helpful in this endeavor:
• Electrical contractor employment
• Industrial employment
• Building permits
• Population growth
• Gross Metropolitan Product (GMP) and Gross State Product (GSP)
The good news is that this data is available, and it’s free. The bad news is that it’s always at least a few months old. With the local GDP data and population estimates, the data is at least a year old, so in some ways the you’re looking at a local market area in the rear-view mirror to see where it has been. If you need forecast data for local markets looking out a few years, you can purchase it from DISC Corp. (www.disccorp.com). Christian Sokoll recently purchased the company from its founder, Herm Isenstein.
Electrical contractor employment. As mentioned earlier you can use this data to create an estimated sales potential for different areas of geography when you use the EW Market Planning Guide’s sales-potential-per-employee multiplier for electrical contractors of $66,313.
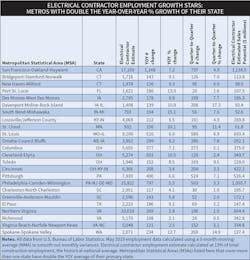
With employment and sales potential estimates on hand, you can slice and dice the data a number of different ways. One exercise that may be of interest is to identify the fastest-growing MSAs in a state by identifying the metros where electrical contractors are hiring employees at more than twice the YOY rate of the state as a whole. In the chart on page 17 you can see examples of MSAs growing at this rate — in many cases are also beating the +4.1% YOY national growth rate for electrical contractor employment. We found it interesting that many of the MSAs growing at double the YOY growth rate of their state aren’t necessarily in the higher-growth regions in the United States. For example, most of Ohio’s largest MSAs, including Cleveland, Cincinnati, Columbus, and Toledo passed muster with this metric, as did Pittsburgh in Pennsylvania, and Bridgeport-Stamford-Norwalk and New Haven-Milford MSAs in Connecticut. The U.S. Bureau of Labor Statistics updates this data each month at www.bls.gov.
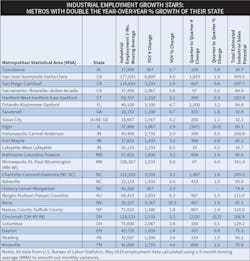
Industrial employment. You can use this data in the same manner as the electrical contractor data by plugging in EW’s sales-per-employee multipliers for the industrial market: Industrial MRO - $789 per employee; Industrial OEM - $825 per employee; and Factory Automation - $108 per employee. The “Total Estimated Industrial Sales Potential” data shown in the chart on page 18 combines these three estimates for each metro. As was the case with the electrical contractor data, a surprising number of metros outpacing their states’ YOY employment growth rates were not in market areas typically regarded as high-growth, such as Tuscaloosa, AL; Elgin, IL and Indianapolis, Fort Wayne and Lafayette, IN.
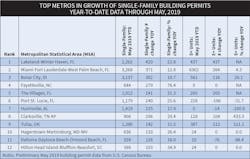
Building permits. Although over the past few months the national YOY data for single-family building permits has been running -6% to -7% below the 2018 data, a diverse array of MSAs are running far ahead of this pace through May. For instance, there are 12 MSAs that have issued 100 building permits more in May 2019 than they did in May 2018 that are also seeing their building permit activity up more than 10% (see chart). Four of these MSAs are in Florida: Lakeland-Winter Haven FL; Miami-Fort Lauderdale-West Palm Beach, FL; The Villages, FL; and Deltona-Daytona Bach-Ormond, FL. Economists track both single-family and multi-family building permits, but they tend to focus more on the single-family data because it accounts for a larger slice of the overall residential construction market and the data is not as volatile as in the multi-family segment, which can vary wildly from month-to-month. You can find this data at www.census.gov/construction/bps/msamonthly.html.
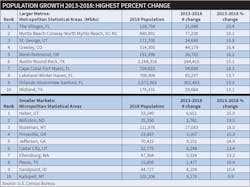
Population growth. You will see some familiar names amongst the MSAs and micropolitan statistical areas (smaller markets with a population of at least 10,000 but less than 50,000 residents) that showed the highest percentage increases in the number of new residents from 2013-2018 in the chart on page 20. Leading this list are the Orlando-Kissimmee-Sanford, FL MSA with 302,483 new residents and the Austin-Round Rock, TX MSA, which added 284,415 new residents. Bozeman and Kalispell, MT led the list of smaller metros, with increases of 17,083 and 9,170 new residents, respectively. This data is available at www.census.gov.
Gross Metropolitan Product (GMP). Published annually by the U.S. Bureau of Economic Research (www.bea.gov), this data gives you a sense how fast a local market’s total economy is growing. Ten MSAs had GMP growth in 2017 (the most current data available) of double the current national GDP growth rate of 3.1%, according to BEA.
Summary. The data sources from the federal government profiled in this article can give you a good feel for the health of your local markets and potential for growth down the road. Blending this data with information on local construction projects, plant expansions and other local economic data such as the unemployment rate, and news on local business start-ups will offer a good basic economic profiles of a local market. If you don’t have the time to gather this data yourself, as mentioned earlier, a $99 annual subscription to Electrical Marketing newsletter offers 24/7 online access to these local economic indicators. DISC Corp. is also a good source of electrical sales forecasts by customer type at the local market level and other sales forecast data.
About the Author
Jim Lucy
Editor-in-Chief of Electrical Wholesaling and Electrical Marketing
Jim Lucy has been wandering through the electrical market for more than 40 years, most of the time as an editor for Electrical Wholesaling and Electrical Marketing newsletter, and as a contributing writer for EC&M magazine During that time he and the editorial team for the publications have won numerous national awards for their coverage of the electrical business. He showed an early interest in electricity, when as a youth he had an idea for a hot dog cooker. Unfortunately, the first crude prototype malfunctioned and the arc nearly blew him out of his parents' basement.
Before becoming an editor for Electrical Wholesaling and Electrical Marketing, he earned a BA degree in journalism and a MA in communications from Glassboro State College, Glassboro, NJ., which is formerly best known as the site of the 1967 summit meeting between President Lyndon Johnson and Russian Premier Aleksei Nikolayevich Kosygin, and now best known as the New Jersey state college that changed its name in 1992 to Rowan University because of a generous $100 million donation by N.J. zillionaire industrialist Henry Rowan. Jim is a Brooklyn-born Jersey Guy happily transplanted with his wife and three sons in the fertile plains of Kansas for the past 30 years.