Managing Your Supply Chain - Part 3

If you have a hub-and-spoke arrangement as your primary distribution network, then your main objective should be to minimize the total inventory across the distribution network while meeting your desired service levels to end customers. You may want to investigate inventory optimization (IO) as a solution.
MCA & Associates’ white paper — “Lean Thinking in Wholesale Distribution Supply Chains — Do You Pull or Push?” (available at www.mcaassociates.com) describes how distributors can begin to “pull” inventory through the supply chain rather than “push” it. In conjunction with IO, you can then use the customer’s demand signal (the buy signal) as an inventory driver to drive replenishment, rather than the traditional demand forecasts at all levels.
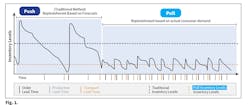
You could also synchronize replenishment order strategies by taking into consideration all of the other inventory drivers we have discussed in the previous two articles — lead-time, desired service levels and replenishment order frequency. Then you could examine the alternatives and do some “What-if?” exercises. To explore why are these inventory drivers so important? Fig. 1 on page 22, which illustrates the “Push-Pull” concept, shows that on the right side, the inventory peaks are lower, the inventory lows are higher, and the period between replenishment cycles is shorter.
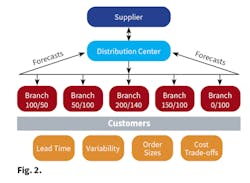
We should challenge some of these “facts of life” in inventory management. Let’s look at Fig. 2, also on page 22. The forecast (the first number in the Branch boxes) and the actual demand (the second number in the boxes) shows significant variance at each “spoke,” although at the DC (distribution center) level, the variance is more acceptable. Now, consider that the narrower the aggregation, the worse the answer becomes. In other words, the question of how much you will “consume” of a product, perhaps from the distribution center, will typically provide a better answer to the question, “How much product will you sell from one of the spokes?” It’s just a statistical truth.
THE PULL APPROACH TO INVENTORY MANAGEMENT
So, there is a tendency to “push” inventory throughout the supply chain, based on the specific method of calculating forecast. Demand variability is often not recognized quickly or even communicated to the source of supply. If we just remember that forecasts are not actual consumption, then many of the dilemmas we often face, like high inventory, moving parts long distance, and inventory counting could be eliminated.
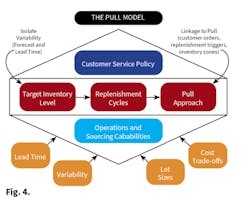
This gets us to a “Pull” approach alternative. “Pull” is similar to just-in-time and the Kanban approach to designing efficient work flow. With this philosophy, as product is sold, a replacement is “pulled” through the supply chain. Now we are doing it based on real demand and actual consumption — the customer’s buy signal.
We use these buy signals in our everyday life. Consider the gas gauge in your automobile, which indicates when you need to purchase more gasoline, or the empty message that a vending machine displays when more products need to be loaded from the vendor.
So maybe you already see the difference between “push” and “pull.” But, what we commonly experience with the Pull inventory management concept is smaller replenishment order sizes, which means increased product delivery frequency from the source of supply. Remember that replenishment order frequency is an inventory driver. You might think this runs counter to many supply chain relationship strategies, but first consider the basic Pull principles.
1. Aggregate inventory at the DC/hub.
As I previously mentioned, demand is more accurate at this particular level and will improve the timing and the order quantity accuracy of the products you order from your suppliers.
2. Pull inventory to the spokes.
Replenish the spokes based on the customer’s buy signal as opposed to pushing inventory to them, based on forecasts and their inherent variability.
3. Replenish inventory as frequently as possible to foster a continuous flow.
This shortens re-order lead-times and creates a shorter time between replenishment orders (one of the inventory drivers). This dampens the variability in demand and reduces safety stock needs.
4. Develop and maintain target inventory levels.
These can be calculated in several ways. The specific calculation method and its use are covered in our previously noted white paper. Basically, target inventory levels are the quantity of inventory you shoot for in the pipeline. Why do you need target inventory levels? Because they provide the buffer inventory to cover demand and the replenishment lead-time as well as protecting against shortages. Target inventory level penetration (TIL) can be measured to provide a means to monitor how well target inventory levels are being managed.
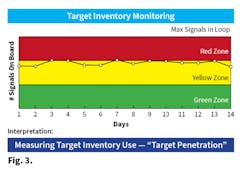
- Green: Less than 33% TIL penetration
- Yellow: Between 33% and 67% TIL penetration
- Red: Between 67% and 100% TIL penetration
Too many products in the green zone may mean inventories are too high relative to actual customer consumption. On the other side, too many products in the red zone may mean you have problems with inventory replenishment timing or some very unusual customer consumption.
Figure 3 illustrates how you can use target inventory level penetration to measure and visually monitor TIL use. This could even be used as signals to your source of supply (DC or supplier) as to what the priority and urgency of product need is.
Additionally, these graphical representations could be provided at most any level: company-wide, location level, A-B-C stratification level, etc. You could even measure the time in a zone and/or the number of products in a zone. Regardless, it now becomes actionable.
5. Develop new relationships with suppliers that incorporate the Pull philosophy. You hear so much about supply partner collaboration that the term has nearly lost its meaning.
The truth is that suppliers who have not adopted a lean thinking philosophy have a mass production mindset. It’s kind of a disconnected functional silo, one that focuses on their own local optimization. In other words, they view the key to controlling or reducing costs as a reason to produce in large batches; spreading their fixed costs over a large population of product— reducing unit costs — as well as using this approach to protect themselves from forecast error.
This drives an economy of scale model and that’s how they get measured — produce large batches, potentially consuming their capacity with product that may not be immediately needed.
A supply chain manager may get measured by the purchase cost achieved, including transportation. In contrast, your suppliers get measured by their unit cost of manufacturing. What gets forgotten sometimes is the impact of this — a surplus of inventory beyond the immediate need, or perhaps even shortages of product, because everyone is too busy either buying or manufacturing something else.
What if you could apply these same Pull principles with your suppliers so they are producing what their customer (you) need, rather than anticipating (forecasting) what they think you’ll need, while having better control over their production capacity, too. There is an opportunity to get suppliers to think differently. This might lead to more frequent re-supply to the whole supply chain, increasing the velocity of product throughout the supply chain, reducing their forecast variation, and reducing their lead-times.
This new collaboration approach should begin around the discussion of continuous flow and becoming more synchronous. Consider sharing your buy signals with your suppliers. The possibility of a direct data connection with suppliers to communicate these buy signals is intriguing because there can be aligned interests. You could even share your target inventory level penetration monitoring with them, or maybe they could even generate their own, based on their inventory position.
A CALL TO ACTION
Committing an organization to realizing the benefits of inventory optimization and a Pull-based lean supply chain will require a change in business philosophy. Distributors should view inventory and supply chain management as an untapped profit and service level enhancer, as well as a cash saver. By making these concepts a reality, you can reduce your total supply chain costs, generate additional capital, increase service level, and finally attain that elusive supplier collaboration objective. This three part-series is available in its entirety at www.ewweb.com.
Howard Coleman and his team at MCA Associates helps distributors and manufacturers implement continuous improvement solutions focused on business process re-engineering, inventory and supply chain management, sales development and revenue generation, information systems and technology, organizational assessment and development. MCA Associates may be contacted at 203-732-0603, or by e-mail at [email protected].
About the Author

Howard Coleman
Howard Coleman and his team at MCA Associates (www.mcaassociates.com) helps distributors and manufacturers implement continuous improvement solutions focused on business process re-engineering, inventory and supply chain management, sales development and revenue generation, information systems and technology, organizational assessment and development. MCA Associates may be contacted at 203-732-0603, or by email at [email protected].