Riding the Rebound: Herm Isenstein's 2014 electrical industry outlook
The Great Recession blew a hole in the floor of the electrical wholesale industry. Why are we still talking about that when it was more than four years ago? Because we are still paying a heavy price and the effects are still with us today. In the past four years since the financial crisis, the overall economic environment has not provided the business sector with the confidence to take calculated investment risks and that in large measure explains the slow pace of recovery.
Anything that slows the overall economy slows growth in the electrical industry. These are issues over which we as independent businesses or as an industry have no control. But we live with the consequences. Now we are four years into the recovery, and from a historical perspective this industry’s recovery is nowhere near as robust as the last electrical industry recovery. Here are the facts to back this up.
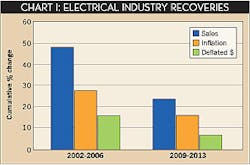
Comparative recoveries. The bottom of the previous industry downturn was in 2002 and industry sales declined almost 9% from the 2001 level. But four years out, to 2006, cumulative electrical industry sales were nearly 50% higher than in 2002. That’s a reasonably good bounce back from an industry recession.
There are more differences than there are similarities between the two downturns and recoveries. In the four years since the 2009 industry downturn, sales advanced cumulatively about 25%. Compare this with the nearly 50% rebound in the previous recession.
The point of this information is not to relive the past but to recognize the consequences of what we mean by a slow recovery. It’s not only jobs that are lost. A slow recovery creates a gap between actual revenues and potential revenues, and by extension, profit dollars.
Had we recovered at the same rate as the previous recovery our industry revenues this year would be about 20% higher than our projected 2013 revenues. Recessions have consequences, and how the economy is managed in the recovery that follows the downturn determines the pace of recovery. I am waiving discussion of return on investment (ROI) and industry productivity because it’s beyond the scope of this article. That is all history. But what lies ahead is more useful for planning your business.
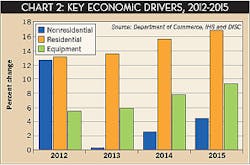
First, the environment we operate in this year has been relatively weak. Nonresidential construction spending is expected to grow a meager 0.4% in 2013 from the 2012 level. Business investment in equipment is expected to increase nearly 6%. But a key driver of industry sales is a relatively strong residential construction market, up 13.5% this year. (See chart 2).
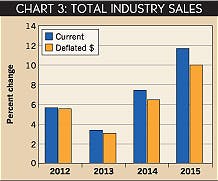
In total, this will lead to a 3.5% growth in electrical industry sales this year. This is not a stellar year for distributors. By comparison, in 2010, the first year of recovery, sales gained 2.9%. So 2013 is the smallest percentage gain since then. Moreover, it will be the smallest percentage gain through 2005.
An important consideration is our outlook for inflation, which from all indications is expected to be “benign” over our forecast cycle. With stable prices, the way to grow your revenues is through pushing more products out the door. And that means prospecting and identifying new opportunities. Raising prices in a noninflationary environment becomes problematic.
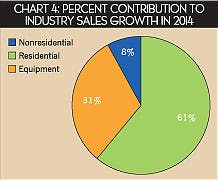
Sources of industry growth. Chart 4 shows that the major thrust of industry sales growth will come from the residential market. This chart quantifies how much of industry growth comes from each the three key economic drivers of the electrical industry.
Summary. The overall economic recovery is very slow and we have quantified just how much impact it’s having on the recovery in the electrical industry. The pace of industry growth is governed by the pace of growth in the three key economic indicators. And the contribution of each key indicator to industry growth is clear.
Since founding DISC Corp. almost 30 years ago, Herm Isenstein has become the premier economist in the electrical wholesaling industry. To contact him, call 203-799-3673 or email him at [email protected]. You may be interested in a new DISC database that will forecast industry sales to end customers by zip code. The information available by zip code includes how much end customers buy by industry classification; number of end-user employees; number plant of locations; and the dollar-per-employee multiplier. For more information on this new database, check out the DISC Corp. ad on page 20.
About the Author
Herm Isenstein
Herm passed away in Sept. 2019 at the age of 86 from brain cancer. He was a good friend to the editors on the staff of Electrical Wholesaling and a prolific writer for the magazine for 15 years.
During his 30-plus years in the electrical industry, Herm Isenstein was the premier economist in the electrical wholesaling industry If you have any questions about DISC's subscription-based data services, contact Chris Sokoll, DISC's president at at 346-339-7528.
