By Christian Sokoll
Forecasting is crucial to the human condition. From stocking the family pantry for the week to estimating the time it takes to get to work. It’s in our nature to gather data, predict needs and forecast results.
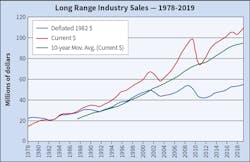
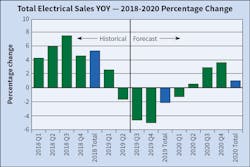
DISC Corp., Houston, TX, is currently forecasting that the electrical distribution industry will sell $110.6 billion in 2019, and we look for modest growth in 2020 of +1.1%, give or take. As an electrical distributor, manufacturer or independent manufacturers’ rep, I would want to use that number to calculate my overall percentage of market share. Most of us are familiar with the basic equation used to calculate market share:
(Sales / Market Size) = % of Share
But this equation only tells part of the story. The competitive spirit in our distribution DNA wants us to understand the score at a much deeper level. What is my share by region? By market segment? By branch, county, zip code, salesperson and product? Where do I look for future opportunity to grow my share? Are my resources in the correct places to ensure I have the right amount of coverage to meet the demand?
To answer these questions, you need to dive as deeply as possible into the big four economic drivers of the electrical industry: the contractor, industrial, institutional and utility businesses. By understanding historical trends and doing some mathematical “What If” modeling of future performance, you can develop a deeper understanding of your market while building a roadmap to success. Thoughtful consideration of the contractor, utility, institutional and industrial markets in the areas you serve can provide these vital insights. End users in these four segments buy the bread-and-butter pieces and parts that keep the electrical distribution industry humming along. How we predict the movements of these markets, what data we look at, and how these forecasts are used is critical to our success.
Supply and demand economics and forecasting are not all inclusive, nor do they rise to a level of certainty with absolute precision. The expectation of any economic forecast is that by using reliable information from the past and applying mathematical modeling, we can make a reasonably accurate prediction of the future. Dependable forecasting models are truthful, use numerous and consistent inputs from period to period, consider changes in policies that impact our industry, are normalized for inflation, and are traceable back to the source data.
There are many resources available for you to gather this information. Jim Lucy and Electrical Wholesaling do an outstanding job of market research and forecasting. My company, DISC Corp., has been researching and forecasting the economics of the electrical industry since 1985. Other sources — the U.S. Census Bureau, U.S. Bureau of Labor and Statistics, and FRED (Federal Reserve Economic Data) are excellent and reliable resources.
Today we are bombarded with information from all sides. It’s important to be able to recognize bad data. Unreliable data and forecasts are generally opportunistic, easily manipulated and hard to verify. In 1954, Darryl Huff authored the book How to Lie with Statistics, which provides guidance on “How to look a phony statistic in the eye and face it down; and no less important, how to recognize sound and usable data in the wilderness of fraud.” His guidance is even more relevant today than it was then.
In a perfect world, the demand side is always just a little bit larger than the supply side. The goal of data gathering and forecasting is to have timely, directionally accurate and consistent business intelligence that allows you to maximize competitive advantage. Ideally, your supply should line up with demand in a way that helps you manage or anticipate the needs of the markets you serve, while leaving some money in the register at the end of each month. Understanding historical shifts in markets and forecasting the future can prepare you for changes in supply and demand that can impact your business. Take the time to forecast, model and plan: Your success depends on it.
DISC Corp. has analyzed and forecasted the economics of electrical distributor-served markets for 30+ years. Its proven methodologies provide market insights to distributors, manufacturers, independent reps and financial analysts. To learn more about DISC’s forecasts contact Christian Sokoll, president at [email protected]/346-339-7528/www.disccorp.com.
Sidebar: DISC Corp.’s 2020 Forecast: Be Prepared for Modest Growth and Deceleration in Several Key Market Drivers
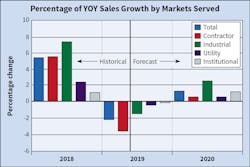
DISC Corp. forecasts overall 2019 electrical distributor-served markets to be down -2.2% year-over-year (YOY)from a strong performance in 2018. Looking ahead, we are forecasting modest +1.1% growth for 2020. The primary drivers are a -3.4% YOY deceleration in the contractor market in 2019 that will not return to growth until Q3 2020. We are tracking the 2019 industrial market to end -1.8% behind 2018. Our 2020 forecast is for 2.2% growth in this market. Our 2019 institutional market performance is relatively flat at -0.1%, and we are forecasting growth of +1.1% for 2020. The utility market will end 2019 down -0.9% year over year, and the 2020 utility forecast is for a slight +0.5% increase.
The impact of trade policy uncertainty on the electrical market. Trade policy uncertainty and tariffs affect the electrical distribution industry in two ways. First is the impact to cost of goods for those items with tariffs that are imported, as well as component parts in equipment that manufacturers must pass on to the distribution channel. This impact varies by the imported product tariff schedules.
Secondly, multi-source economic research exists that ties capital spending directly to trade policy uncertainty. DISC is forecasting equipment spending slowing from +5.6% YOY in 2018 to an average of +2.7% between 2020-2023. Structures share a similar trend, slowing from +4.1% in 2018 to -0.5% average 2020-2023. With a large global footprint, the manufacturing sector takes the brunt of the impact of capital spending on equipment and structures tied to trade policy uncertainty.
About the Author
Christian Sokoll
Meet Chris Sokoll
Chris began his career in the electrical industry 30 years ago in Spokane, WA, in the way so many in the electrical wholesaling space have – working the counter and the phones. He relocated to Phoenix, Arizona, and continued his career progression in an inside sales role with King Wire covering the Southwest. His next stop was Atlanta, where he continued to learn the business and worked the Southeast region. Little did Chris know that a move back to Washington state would start a career with Houston Wire & Cable that would span nearly three decades.
Chris was named “New Salesperson of the Year” in 1991 for his outstanding results and won additional awards for sales growth by supporting oil and gas exploration in the North Slope and managing a joint contract with Boeing. He progressed in his career taking an outside sales position in Lexington, KY, working with electrical distribution business development on major corporate accounts such as Mead Paper, DOW / Dupont, and the Savannah River Project. Chris was promoted to Regional Manager over the Southeast and again proved himself by significantly growing both sales and profitability.
Chris was asked to take on a turnaround project for Houston Wire & Cable’s Midwest Region, headquartered in the Chicago metro area, where he nearly tripled the region’s sales – from $24 million to $74 million. During his tenure in Chicago, Chris won numerous management and vendor awards for new product rollouts, sales growth, and national account management. His team won more “President’s Circle” sales awards than any of the other 11 Houston Wire & Cable locations. This high level of performance resulted in Chris earning a position as Regional Vice President.
Chris’s next stop was as Division President for Southern Wire, a heavy lift equipment wholesale subsidiary of Houston Wire & Cable based near Memphis, TN. He took this position post-acquisition and integrated the division, managed a transition of computer systems, and developed a segmented market plan while retaining all employees. Chris was able to buy out a competitor’s inventory, resulting in their exit from the market, and then hired their VP of Sales to step in as President of Southern Wire. This facilitated Chris’s next role as Corporate VP of National Business Development based in Houston, where his first responsibilities included continued oversight of Southern Wire, managing the Cable Management Services Project Group, and directing the National Service Center, a training and development group for new sales professionals entering the industry.
During this time overseeing so many critical divisions, Chris became more immersed in business intelligence and market data analysis – leading to innovative internal changes at Houston Wire & Cable. Chris learned to use and blend data from multiple sources such as DISCCORP, Industrial Information Resources (“IIR”), and ERP and CRM data to aid the company in embracing data and visualization tools in a completely new and unprecedented fashion. Chris deployed industry-leading corporate analytics and business intelligence tools such as Tableau, Power BI, Alteryx, Access, and Excel to inform and improve decisions and track KPIs. Likewise, he provided reporting for the board of directors and senior management team both in spreadsheets and in various advanced visual presentation formats. Chris also designed, tracked and approved compensation programs for sales reps and agents, and was also instrumental in the design and tracking of customer rebate programs.
In 2019, after working closely with DISC Corp. as a customer for five years and thus seeing the ongoing need for quality market intelligence data for the industry, Chris left Houston Wire & Cable to purchase DISC Corp. from its founder, Herm Isenstein. Along with being the leading economist in the electrical market for more than 30 years through his work at DISC, Herm was also a prolific author for Electrical Wholesaling magazine.
Herm passed away in Sept. 2019, but Chris continues to grow DISC’s vision while maintaining its leadership position as a trusted data source. By diligently working alongside DISC Corp.'s economists, programmers, and marketers, Chris embraces his passion to ensure that DISC continues delivering high-quality business intelligence and forecasting to further the future of the electrical wholesaling industry.
Chris holds a bachelor’s degree in organizational leadership from Roosevelt University in Chicago and a graduate certificate in finance from the University of Chicago. Chris has completed various Microsoft training programs in Excel and Access in addition to data science theory, and he has written college-level course material on Microsoft Power BI and Excel.


