2023 Market Planning Guide

It’s tough to say if forecasting 2023 market conditions for the electrical wholesaling industry will be more challenging this year than it has been in the past. But this year, you must consider a unique mix of new and old macroeconomic factors and industry-specific market conditions when developing your electrical 2023 market forecast. Price increases, product shortages and concerns over the long-term demand for office space, a huge market for electrical distributors, reps, manufacturers, contractors and other buying influences, because of the move to remote work, were also top-of-mind in 2022.
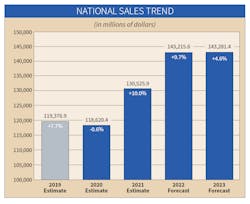
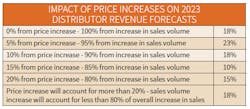
The respondents to the survey for EW’s 2023 Market Planning Guide were a bit more bullish in their prognostications for 2023, and with their input, Electrical Wholesaling is forecasting a +4.6% increase in 2023 sales. A big challenge in developing a 2023 forecast is figuring out how much of any sales increase is due to real demand and how much is due to price increases. Data from the quarterly survey of distributors that Electrical Marketing newsletter does with the Vertical Research Partners (VRP) equity research firm showed that in 3Q 2022, higher prices accounted for about 43% of the +13.5% quarter-to-quarter revenue increase. If prices continue to increase at that rate in 2023, the real growth in EW’s 2023 forecast (minus the price increase) would be closer to +2%.
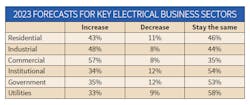
EW’s editors also found a wide range of forecasts for the economic prospects of the 2023 nonresidential construction market from eight of the nation’s leading construction economists in the Consensus Construction Forecast published by the American Institute of Architects (AIA). AIA develops this forecast (updated in July 2022) with the help of economists from Dodge Construction Network, S&P Global Market Intelligence, Moody’s Analytics, FMI, ConstructConnect, Associated Builders & Contractors, Wells Fargo Securities and Markstein Advisors. AIA’s consensus forecast for the 2023 nonresidential market calls for a +6% increase. Economists at these firms saw the market differently. Their forecasts ranged from three double-digit increases — +14.7% by FMI; +12.9% by ConstructConnect; and +10.6% by Dodge Construction Network — to three forecasts that were less than half the growth rate of AIA’s Consensus Forecast for the nonresidential segment. Calling for less growth were economists from Wells Fargo Securities, Associated Builders & Contractors and Markstein Advisors. They see nonresidential market growth coming in at less than +3% next year.
While the ABI has been strong for most of 2022, Baker said in the most recent ABI report that some signs of an economic slowdown are emerging. AIA’s Architecture Billings Index (ABI) score for October was 47.7 points, the first decline in billings since January 2021 (any score below 50 indicates a decline in firm billings). Inquiries into new projects continued to grow in October with a score of 52.3 points, while the value of new design contracts declined, with a score of 48.6 points.
“Economic headwinds have been steadily mounting, and finally led to weakening demand for new projects,” he said. “Firm backlogs are healthy and will hopefully provide healthy levels of design activity against fewer new projects entering the pipeline should this weakness persist.”
As you prepare your own 2023 economic forecast, remember that local market conditions can vary wildly from any macroeconomic prognostication. Be sure to use any national outlook as a point of comparison to see how your local market, state or region compares with it in terms of any forecasted rate of change in revenue, or the market drivers that will affect your business in the year to come. Following are EW’s picks for the economic drivers and market trends to consider in your forecast.
2023 Macroeconomic Outlook
The Conference Board offers two solid monthly macroeconomic indicators — its Measure of CEO Confidence and its U.S. Leading Economic Indicators (LEI). The most recent reports were both pessimistic. The Conference Board said CEO confidence sunk further to start Q3 and is at its lowest level since the Great Recession, while the association’s LEI report said a recession is likely before year-end.
Price Increases Continue for Electrical Products
Long Lead Times are Still a Factor
Lead times for many electrical products aren’t as bad as they used to be, but in many cases are still months from normal. Switchgear has lead times that can extend out more than a year, according to distributor response in the Electrical Marketing/VRP quarterly survey. They are also still an issue with products like lighting controls and automation equipment powered or controlled by semiconductor chips.
A Tough Slog for Single-Family Construction
Single-family construction will probably be the slowest market sector over the next year or two, as sky-high interest rates, affordability issues and lack of buildable lots in many popular markets are pummeling homebuilders. Market conditions for multi-family construction aren’t as dismal. While some Sunbelt markets are scratching out increases in single-family construction, the national data on housing starts and building permits is downright ugly. Multi-family construction is also expected to slow, but according to NAHB’s 2022 forecast, it will be up +18.1% this year before sliding -8% in 2023.
The Impact of the Work-at-Home Trend on Office Construction and Renovation

Labor Shortages Persist for Electrical Distributors, as Well as their Customers and Vendors
It seems like no one in the electrical market can find enough employees when they need to hire. Even though total U.S. employment at electrical contractors is trending at over 1 million employees for the first time ever, electrical contractors seem to be having the most trouble attracting and keeping new employees. This challenge has created a market opportunity for companies on the supply side that can provide new tools and preassembled electrical products that help electrical contractors work smarter and more efficiently in the field.
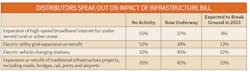
Infrastructure Stimulus
HOW TO USE THE MARKET PLANNING GUIDE
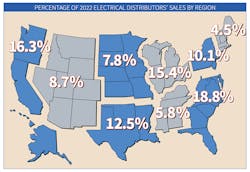
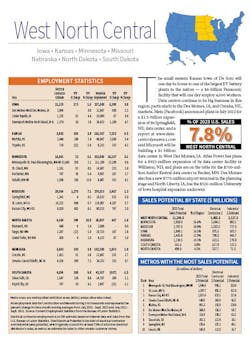
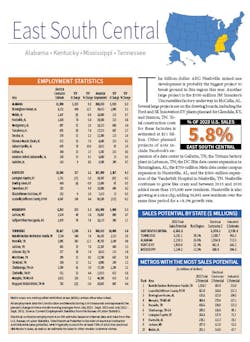
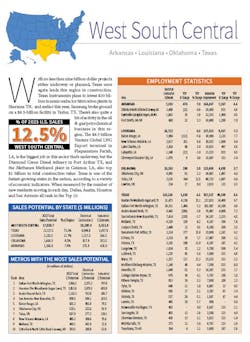
The market planning data in this issue is divided into nine regions of the United States. For each region, you’ll find an economic snapshot of the region and employment statistics for the typical distributor’s two largest customer groups — electrical contractors and manufacturing employees; and sales potential by state and for each region’s largest MSAs. We develop those estimates using sales-per-employee multipliers and employment data published by the U.S. Bureau of Labor Statistics (a three-month average of employment data from July 2022 through Sept. 2022).
Methodology. Our forecasts are based upon responses to EW’s annual Market Planning Guide (MPG) survey. Each year, the magazine asks electrical distributors for their previous year’s final sales results, sales predictions for the current year, and predictions for the following year. It also asks respondents how sales for the first six months of the current year compared with the first six months of the previous year.
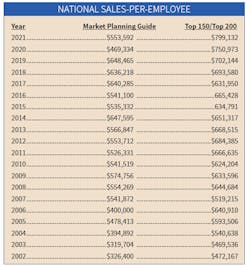
With 199 electrical distributors providing sales forecasts and other information, we are able to provide a reliable national forecast for sales through electrical distributors. Please respond to next year’s survey when you see it — filling it out only takes a few minutes and it helps us produce more reliable electrical sales forecasts. On a national basis, respondents reported a mean sales-per-employee number of $553,592 in 2021, a healthy increase from $469,334 for 2020, but significantly less than the $799,132 sales-per-employee reported by our Top 150 Electrical Distributors in the May-June issue. Be sure to check how your company’s productivity compares with the national when it comes to sales-per-employee.
A note on our national sales base number. The base sales number for our national sales forecast comes from the Census of Wholesale Trade that the Commerce Department sends out every five years. Data from the most recent survey in 2012 was finally available in 2015 for the category that most closely defines our electrical market — “NAICS: 423610 - Electrical apparatus and equipment, wiring supplies and related equipment merchant wholesalers” (specifically “Merchant wholesalers, except manufacturers’ sales branches and offices”). Although the Commerce Dept. recently published its national numbers for its definition of a distributor of electrical supplies, EW will not use this number as a base for its sales estimates until the Commerce Dept. also publishes its product sales data. EW’s editors need the product data to refine the Commerce Dept.’s sales estimates for electrical wholesalers.
Here’s why. The U.S. Commerce Dept. has a very broad definition of an electrical distributor, and its 2017 data shows 8,398 electrical distributors operating 13,801 branch locations and doing $131,748,162 in total combined revenue. Electrical Wholesaling’s editors don’t believe the Commerce Dept.’s 2017 sales number is accurate because the related product data in the 2012 survey included distributors of HVAC equipment, electronics components and other products not typically carried by full-line distributors of electrical supplies.
Including these companies basically doubles the company count for what EW’s editors and most veteran industry execs would consider to be distributors of electrical supplies. The huge branch count in the 2012 Commerce Dept. data really sticks out, too, when you compare it to the branch count in Electrical Wholesaling’s most recent Top 150 ranking. The distributors in that ranking operate 7,000-plus branches, quite short of the Census estimate.
When the 2012 Census of Wholesale Trade came out, we worked with the late Herm Isenstein, founder, DISC Corp., Orange, Conn., to develop a base sales estimate for 2012 of $86.5 billion. EW’s sales estimates will use this base national sales number until the product data for the next Census of Wholesale Survey is available. Electrical Wholesaling’s editors will “bring forward” that number for an annual national sales forecast each year using the same survey methodology that Andrea Herbert, Electrical Wholesaling’s late chief editor, first developed in the 1970s for the Market Planning Guide.
DEVELOPING SALES ESTIMATES
When developing any market forecast, gathering some basic data on the size and makeup of the market is the first step. Let’s take a look at some of the ways you can crunch the numbers we’ve provided to tailor them to your business. One of the most common uses of this resource is for developing a business plan, whether it be for internal use as your guide for next year or for a presentation to an investor or banker. You will need something that states the size of the local market, and these sales figures are a documented source you can use “as is.”
This data will also be helpful in establishing a sales forecast for your company and your region, comparing nearby or far-flung markets with an eye to opening or closing a branch, and evaluating promising areas of new business. One question distributors should ask themselves — and suppliers will be asking — is: “Are our sales into the market at the level they should be?” Look at the estimate of the overall sales in your market in comparison with your company’s sales.
Employment in major customer markets. In addition to sales forecasts, employment numbers make up a large part of the regional profiles. The number of people employed by a company or in an industry tends to rise and fall with the volume of business it’s doing. Employment figures, therefore, act as a gauge to business prospects and conditions in end-user markets.
- Employee counts can help you compare the relative sizes of various end-user groups in your area.
- You can also compare the make-up of one market area to another, and consider new customer markets or ones that you could be serving better.
- If you track the employment figures for each market over time, you’ll see broad economic trends unfolding in your market.
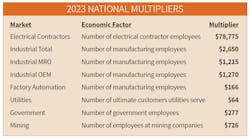
- You can also use these employment figures to make your own multipliers or you can use the national multipliers we’ve already calculated.
For instance, to find the number of electrical contractor employees in Addison, IL, a city not detailed in the East North Central regional profile, you could contact the local Chamber of Commerce, a nearby union chapter, the state university, or the local library to track it down.
These multipliers come in handy if you want to approximate the amount of sales available from a particular account. For example, if a local manufacturer employs 300 people, by applying the multiplier of $1,215, you would expect the facility to purchase about $364,500 worth of electrical MRO products this year.
Using multipliers results in a dollar figure for market size that tells the level of business distributors in the area could do if every potential customer there bought a typical amount of product from them. It tends to be a larger number than actual distributor sales.
You can also use Electrical Wholesaling’s multipliers to track sales through different types of customers over time. For sales to electrical contractors, use Electrical Wholesaling’s national multiplier of $78,775 for each electrical contractor employee.
Summary. While the chances for at least a mild recession in 2023 seem pretty good, few economists seem to expect much more than a mild downtown. Of course, if the war in Ukraine took an unexpected turn, or the current meltdown in parts of the cryptocurrency market spread to equities and bonds, we could be looking at a “Black Swan” event that could radically change economic conditions.
However, this generation of managers in the electrical market have already guided their companies through the depths of the pandemic, and the crisis management skills they needed in the COVID era should be enough to get them through any new and nasty economic surprises.
Click here to download PDF version of Electrical Wholesaling's 2023 Market Planning Guide
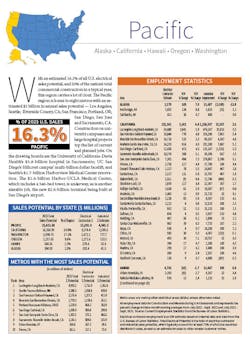
REGIONAL FACTBOOK
Electrical Wholesaling's 2023 Regional Factbook provides employment data you can use to develop sales estimates at the local and state level; estimates for sales potential of the largest market by region and a capsule summary of the economic conditions in each region.
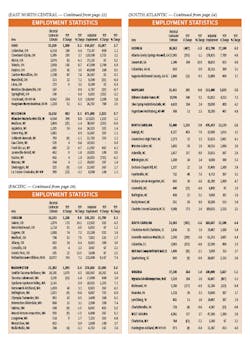
Scroll down for continuation of East North Central Region employment data
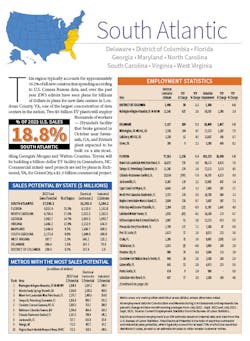
Scroll down for continuation of South Atlantic Region employment statistics

Continuation of Employment Statistics for East North Central, South Atlantic and Pacific Regions