One thing that the electrical industry is not guilty of (among lots of other things), is the fallacy of composition. Basically this fallacy says that what is true of the part is also true of the whole.
Take for example what has been happening in oil exploration areas. Over the past few years, distributors serving those areas have experienced large increases in their sales compared with other geographic areas. Other areas have not even come close to those increases. Clearly the reason is that it’s been a very specific industry engaged in a very specific process in very specific geographic areas.
The only ones who have some idea of just how big those gains have been are the distributors serving those markets. But it’s really interesting that no one has any solid numbers on the overall dollar size and growth in the specific oil exploration areas through the electrical distribution channel.
We do not know for certain what volume of electrical products is consumed in these very specific areas. It is not reported nor is there any legal requirement for such a report. And unless a minimum sample of distributors provide that information, it is unlikely we will ever know the full extent of that market served by the electrical industry.
But DISC has sales numbers in the Metro Areas that are close to where the action is taking place. I recognize that these numbers are a shadow of what is taking place directly in the oil exploration areas. But it does give us a degree of insight into what is taking place.
At this point, we can only focus on the Metro areas that in some way serve the specific oil exploration and extraction areas. We cannot isolate exactly the dollar spend in the exploration areas themselves.
I am confident that we have a good handle estimating the growth in these MSAs. But that growth includes the impact of demand in the oil exploration areas served by distributors located in the MSAs and the impact of demand for electrical products coming from economic activity (construction, etc.) within the MSAs.
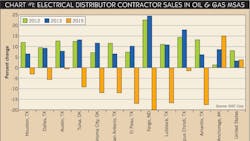
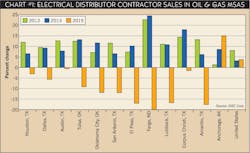
What this suggests is that even if you are not serving the exploration industry, there are opportunities to serve those MSAs in other market segments (see Chart #1).
In 2013, for example, the distributor served contractor market in the MSAs grew at a double digit rate. Fargo, N.D., grew nearly 25%.
Now look at what we expect to see in those same areas this year as a result of the slide in oil prices. Fargo (down 20%), Amarillo (down 18%), Oklahoma City (down 12%).
Several things surface. First, I am likely understating the upturn in the demand for electrical products in 2013 that are a direct result of oil exploration demand, and I am likely understating the direct demand for electrical products in the exploration downturn in 2015.
Second, if there was any doubt where the largest impact is coming from it’s clearly in the contractor market. The distributor-served industrial market does not show the kinds of changes in either 2013 or this year.
To emphasize that the changes shown in the chart are really a consequence of activity in the oil producing areas, notice the difference in the percent change in the national distributor-served contractor market shown in Chart #1. Of the 150 MSAs we track every quarter, these are the only ones that show such growth rates.
Industry Outlook for 2015
For the industry outlook overall, this year is particularly difficult to decipher because we have important indicators moving in opposite directions. We have seen this many times in the past but rarely with such a mixture.
For example, the price index that tracks the changes in distributor prices is declining. This index contains many commodities like copper that are important components of products that distributors sell, like building wire. But although the overall price index is falling, distributors are not lowering their prices.
One or both of two things are happening. One is that vendors are not passing lower prices on to distributors, and/or distributors are not passing the lower prices on to their end customers. To explain why or if that is happening is above my pay grade. But it does present me with an issue in forecasting electrical industry sales. The equation is simple: Price x Quantity = Revenue. So we need to have a handle on price in order to understand revenue.
If we simply follow the expected decline in the “distributor price index,” while distributors are not lowering their prices we may have a nice neat equation. But it would not tell us anything about the real world in the electrical wholesaling industry.
In fact if we took the behavior of the expected price decline at face value and inserted it into our forecast models we would produce negative industry sales this year to the tune of nearly 2%.
In the final analysis, distributor sales are dependent on final demand by the end user, which is construction and industrial demand – buildings, shopping centers, housing (as well as oil exploration), and factory production of autos, etc.
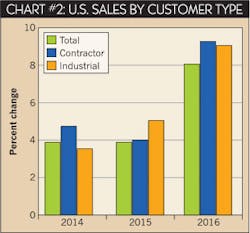
When we look at final demand for this industry we do not see those underlying factors declining at all. We see them increasing around 3% in 2015. Those are the most fundamental elements in the electrical industry (see Chart #2).
As you look at your business this year, recognize that you likely will experience weakness in areas like oil producing and exploration that only a few short years ago were very robust. But overall, a nearly 4% total industry sales growth this year following a similar rate last year is not a calamity.
Next year we expect a stronger economic environment and the electrical industry’s response will propel sales to advance about 8%.
Since founding DISC Corp. almost 30 years ago, Herm Isenstein has become the premier economist in the electrical wholesaling industry He worked for 10-plus years with General Electric in market planning and analysis assignments and before that spent more than four years in Tehran, Iran as an economic advisor to the Iranian Oil Operating Companies. His educational background is in economics and econometrics and he holds an MBA from the University of Chicago. If you have any questions about DISC’s subscription-based data services, contact Herm at 203-799-3673.
About the Author
Herm Isenstein
Herm passed away in Sept. 2019 at the age of 86 from brain cancer. He was a good friend to the editors on the staff of Electrical Wholesaling and a prolific writer for the magazine for 15 years.
During his 30-plus years in the electrical industry, Herm Isenstein was the premier economist in the electrical wholesaling industry If you have any questions about DISC's subscription-based data services, contact Chris Sokoll, DISC's president at at 346-339-7528.


