#1. Customer counts. How many active customers do you have in the current period vs. the number of active customers you had in the prior period? You should always focus on adding new customers while retaining the established ones. DISC Corp.’s feature article published in the Nov./Dec. 2021 issue of Electrical Wholesaling, “Mapping Out Market Clusters,” is a good way to look for new customers in areas where you already have market knowledge. While getting new customers is more expensive than keeping the existing ones, it’s vitally important to prospect and find new customers.
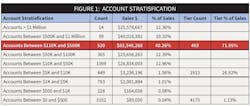
#2.Customer stratification. This is a key tool in helping move customers up in sales buckets simply by identifying them and adding a bit of good old customer service. Tier your customers by sales volumes and counts. “Fig.1: Account Stratification” below will give you an idea of what this looks like. This table has three large tiers and nine smaller tiers. You can see from this chart that of approximately 6,500 customers, 493 are doing just short of 72% of the business.
#3. Invoice count. Increasing the number and frequency of invoices can drive market share gains. When your salespeople get customers to place more orders with increasing frequency, it’s a solid sales practice for growth. Remind your sales team to utilize multiple points of contact and to reach out more frequently to their customers. Make sure they are maximizing all available communication channels, including e-mail, phone, text and web inquiry forms, because it can move the needle on this metric.
#4. Product group counts. This metric goes along with invoice counts. Asking questions at the point-of-sale is a great way to increase the number of product groups you sell to an individual customer. Ask leading questions to introduce related products, such as, “Do you need cable ties and connectors with that wire?” or, “I also have a new cable cutter in stock that I think you would really like.”
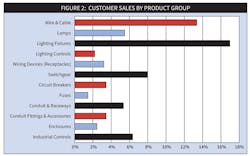
It’s likely you have some add-ons that the customer may not be aware that they need or that they can purchase from you. Helping to simplify their life by clumping these complementary products can save them time and energy from contacting another vendor. Building a model that shows your company's salespeople their sales by product group for each customer is a great way to utilize business intelligence along with the power of Excel to capture more market. “Fig. 2: Customer Sales by Product Group” below illustrates this metric.
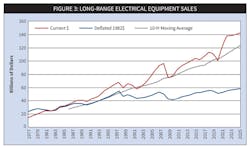
#5. Piece counts and/or weight shipped. Another measure of market share is piece counts and/or weight shipped. When prices by product group are skyrocketing, consider different ways to measure results by product category. Electrical Marketing’s Price Index is reflective of the differences in inflation by product group. Wire is good example of a product group that can easily be overestimated when looking at a revenue perspective. In April 2020, the price of copper was $2.30 per pound. In April 2022, copper was $4.80 per pound, a difference of $2.50. Considering that 500MCM has 1,544 pounds of copper in a 1,000-foot reel, you could sell half as much and generate more revenue. Measure the weight of what you sell, or in the case of hardware and wiring devices, measure the piece counts over time. #6. Removing the inflationary component of total revenues. Another way to get a more accurate measure of your sales revenue results is to remove the inflationary component from both your sales and the market data. “Figure 3: Long-Range Electrical Equipment Sales” below gives you a visualization of the impact inflation has had on the growth in the electrical distribution market. DISC can help you to look at the market from a normalized perspective, removing inflation to better see your actual results. As always, please feel free to reach out to me with questions or comments.
About the Author
Christian Sokoll
Meet Chris Sokoll
Chris began his career in the electrical industry 30 years ago in Spokane, WA, in the way so many in the electrical wholesaling space have – working the counter and the phones. He relocated to Phoenix, Arizona, and continued his career progression in an inside sales role with King Wire covering the Southwest. His next stop was Atlanta, where he continued to learn the business and worked the Southeast region. Little did Chris know that a move back to Washington state would start a career with Houston Wire & Cable that would span nearly three decades.
Chris was named “New Salesperson of the Year” in 1991 for his outstanding results and won additional awards for sales growth by supporting oil and gas exploration in the North Slope and managing a joint contract with Boeing. He progressed in his career taking an outside sales position in Lexington, KY, working with electrical distribution business development on major corporate accounts such as Mead Paper, DOW / Dupont, and the Savannah River Project. Chris was promoted to Regional Manager over the Southeast and again proved himself by significantly growing both sales and profitability.
Chris was asked to take on a turnaround project for Houston Wire & Cable’s Midwest Region, headquartered in the Chicago metro area, where he nearly tripled the region’s sales – from $24 million to $74 million. During his tenure in Chicago, Chris won numerous management and vendor awards for new product rollouts, sales growth, and national account management. His team won more “President’s Circle” sales awards than any of the other 11 Houston Wire & Cable locations. This high level of performance resulted in Chris earning a position as Regional Vice President.
Chris’s next stop was as Division President for Southern Wire, a heavy lift equipment wholesale subsidiary of Houston Wire & Cable based near Memphis, TN. He took this position post-acquisition and integrated the division, managed a transition of computer systems, and developed a segmented market plan while retaining all employees. Chris was able to buy out a competitor’s inventory, resulting in their exit from the market, and then hired their VP of Sales to step in as President of Southern Wire. This facilitated Chris’s next role as Corporate VP of National Business Development based in Houston, where his first responsibilities included continued oversight of Southern Wire, managing the Cable Management Services Project Group, and directing the National Service Center, a training and development group for new sales professionals entering the industry.
During this time overseeing so many critical divisions, Chris became more immersed in business intelligence and market data analysis – leading to innovative internal changes at Houston Wire & Cable. Chris learned to use and blend data from multiple sources such as DISCCORP, Industrial Information Resources (“IIR”), and ERP and CRM data to aid the company in embracing data and visualization tools in a completely new and unprecedented fashion. Chris deployed industry-leading corporate analytics and business intelligence tools such as Tableau, Power BI, Alteryx, Access, and Excel to inform and improve decisions and track KPIs. Likewise, he provided reporting for the board of directors and senior management team both in spreadsheets and in various advanced visual presentation formats. Chris also designed, tracked and approved compensation programs for sales reps and agents, and was also instrumental in the design and tracking of customer rebate programs.
In 2019, after working closely with DISC Corp. as a customer for five years and thus seeing the ongoing need for quality market intelligence data for the industry, Chris left Houston Wire & Cable to purchase DISC Corp. from its founder, Herm Isenstein. Along with being the leading economist in the electrical market for more than 30 years through his work at DISC, Herm was also a prolific author for Electrical Wholesaling magazine.
Herm passed away in Sept. 2019, but Chris continues to grow DISC’s vision while maintaining its leadership position as a trusted data source. By diligently working alongside DISC Corp.'s economists, programmers, and marketers, Chris embraces his passion to ensure that DISC continues delivering high-quality business intelligence and forecasting to further the future of the electrical wholesaling industry.
Chris holds a bachelor’s degree in organizational leadership from Roosevelt University in Chicago and a graduate certificate in finance from the University of Chicago. Chris has completed various Microsoft training programs in Excel and Access in addition to data science theory, and he has written college-level course material on Microsoft Power BI and Excel.


